Top factors that impact the Solar Payback Period (Explained Clearly)
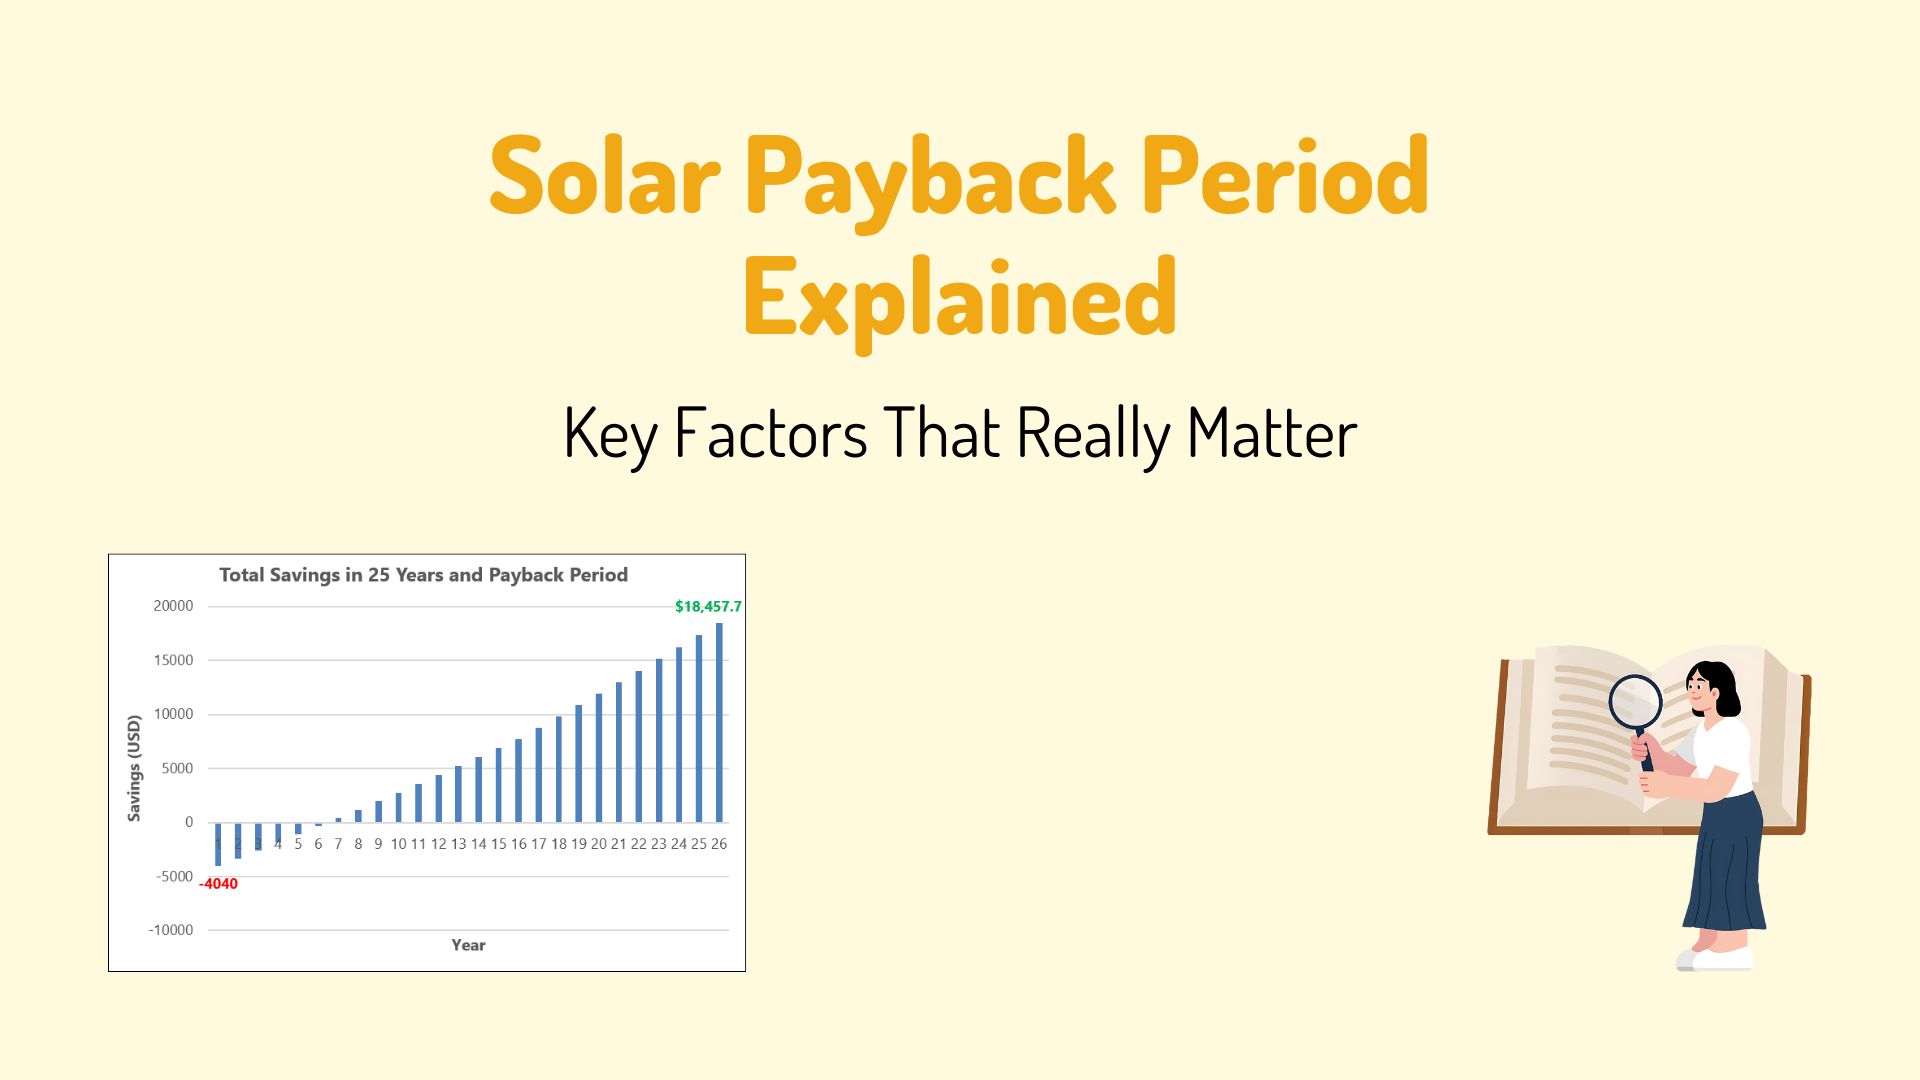
The payback period in solar refers to the amount of time it takes for the savings from a solar power system to equal the total cost of installing the system.
Formula = Total installed cost of the solar/Annual savings from solar
However, the payback period depends on many factors. It is not the same for two households having the same energy needs but living in different locations of the country.
Below are the key factors that influence the payback period of a solar power system.
Sunlight Intensity (Solar Irradiance)
One of the main factors affecting the payback period of a solar power system is sunlight intensity. Sunlight is the input for any solar power system.
If it is sufficient, then the system will produce a good amount of electricity, and you will have a faster payback on your investment.
On the other hand, if the intensity is poor, the solar panels will underperform, and you may need a larger number of solar panels to fulfill your energy needs. That way, poor sunlight increases the cost of the system and may delay the payback period of the system.
The regions close to the equator receive a good amount of sunlight, and as we move farther away from it, the intensity starts reducing.

If I talk about India, it is strategically located (it lies within the latitude of approximately 8°4′ N to 37°6′ N), neither too close to the equator nor too far.

India has around 250 to 300 sunny days throughout the year, making it an ideal choice for solar power generation.
Electricity Consumption and Energy Needs
If your electricity consumption is high, you replace more expensive grid electricity with free solar power.
This means higher annual savings, which leads to a shorter payback period.
If you don’t use much electricity, your solar system generates power that might go unused or be exported at a lower tariff.
This means lower annual savings, resulting in a longer payback period.
Solar Technology and Component Quality
The highly efficient solar panels, like Mono-PERC, Half-cut solar cell technology, and HJT solar panels, produce more power even in a limited space.
Due to their smaller size than the polycrystalline solar panels, a greater number of these panels can be accommodated in a given space. And you can get more energy and hence more savings in that given space. Thus, improving the payback period of the system.

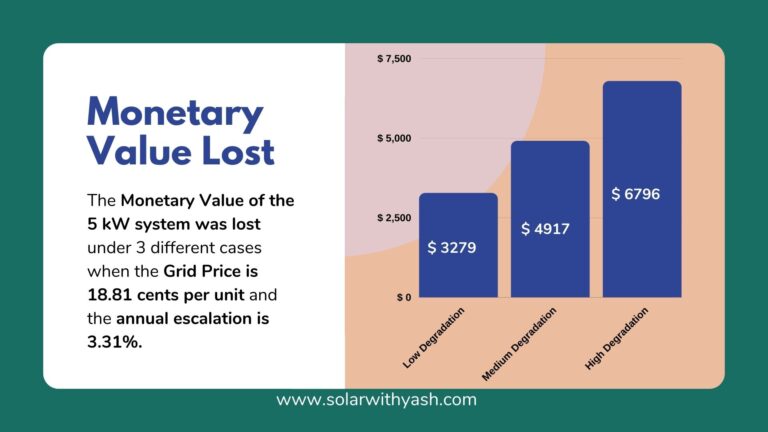
Also, these latest technology solar panels have a lower degradation rate, which means their performance degrades more slowly with time than the conventional solar panels.
In addition, the latest technology solar inverters are designed to capture the maximum power from the solar panels.
Losses in a Solar Power System
Like any other system in the world, solar power systems suffer from certain losses when operating.
Yes, more losses mean delayed payback.
These losses are:
Conversion Loss
When sunlight falls on a solar panel, it creates electricity. But not all the sunlight is converted into usable electricity. Some of it is lost in the process, and that part is called conversion loss. Imagine pouring water from a big jug into a glass. If the glass is small or the jug is leaky, some water spills.

That spilled water = loss
Water in the glass = usable electricity
Where does this loss happen?

- Solar panel losses: Not all sunlight becomes electricity. Most panels are 15–22% efficient, so 78–85% is lost as heat or reflected light.
- Inverter losses: Inverters convert DC to AC power, but lose 4–10% in the process.
- Battery losses: Charging and discharging batteries also waste energy (around 10–20%).
- Shading Loss
Shading loss happens when something blocks sunlight from reaching your solar panels, like trees, buildings, clouds, or even bird droppings.

When even one part of a solar panel is shaded, it can reduce the power output of the whole panel, or sometimes even the entire system.
Dirt Loss

Dirt loss in solar power systems refers to the reduction in energy generation caused by the accumulation of dust, dirt, bird droppings, pollen, or other debris on the surface of solar panels. These obstructions block sunlight from reaching the solar cells, reducing the amount of electricity the panels can generate.
Factors affecting dirt loss:
- Location: Arid, dusty, or polluted environments experience higher dirt loss.
- Tilt Angle: Flat or low-tilt panels collect more dirt and rain runoff is less effective.
- Rainfall: Natural cleaning by rain can reduce dirt accumulation in some regions.
- Maintenance: Regular cleaning schedules can significantly reduce dirt-related losses.
Transmission and Wiring Loss
Transfer loss in a solar power system refers to the loss of electrical energy that occurs when power is transmitted from the solar panels to the point of use (e.g., your appliances or the grid). This happens mainly due to resistance in the wires, connectors, switches, and other components used in the transmission path.

And these losses can cumulatively add up and can eat up to 33% of the solar panel output.

Grid Electricity Price and Tariff Escalation
The higher the current electricity rate, the more money you save by generating your solar power.
A user paying ₹10/kWh will recover their investment faster than someone paying ₹4/kWh.
Electricity costs usually increase every year.
If you’re producing your power, you’re avoiding future price hikes—this increases your savings over time. Let us understand with the help of an example, a 5-kW grid-tied system costs approximately Rs. 3,20,000 in India.
It generates an average of 20 units per day. Therefore in 1 month it will produce 600 units (20 x 30 days) and in a year it will generate 7200 units (600 x 12 months). Let us find the payback period under different scenarios:
| Scenario | Grid Price (Year 1) | Escalation | Payback Period |
| Low tariff, no rise | ₹5/kWh | 0% | 9 years |
| Medium tariff + 5% rise | ₹7/kWh | 5% | 6.5 years |
| High tariff + 6% rise | ₹10/kWh | 6% | 4.5 years |
When I talk about India specifically, here the average grid price is ₹8/kWh when you consume 400 or more units in a month. Also, the grid price is growing at 5-6% per year (taking data for the last 10-15 years). In that way, the per-unit grid price after 25 years would be ₹25.8.

Cost of the Solar System
We know the basic formula for the payback period, which is
Payback Period = Cost of the system/annual savings
The payback period of solar is affected by how you invest in solar, I mean, the debt: equity structure.
Financing Structure (Debt vs Equity)
It is the way that much of the solar power system is financed through debt versus your own money. A 100% equity loan may have a faster payback, while if you have more debt, the interest adds to the system’s cost, and the payback period appears longer.

In the above table, you can see that the effective cost of the system is increasing with the increase in the debt amount. It is because of the interest added to the principal. The more is the debt, more will be the interest amount added to the principal.
Subsidy and Net Metering Impact
The Indian government offers a subsidy for the installation of residential solar on the rooftop. Hence, the subsidy amount reduces the payback period of the system and results in faster payback. Moreover, the net-meter installed feeds the extra solar electricity to the grid and the owner is compensated for this in terms of reduced electricity bill.

Solar System Design Factors
The design of the system has a major impact on the solar payback period because it affects how efficiently your solar panels generate electricity. Here’s how:
Roof Orientation
India lies in the Northern hemisphere, hence south-facing roofs get the maximum sunlight. The East or West-facing roofs get less sunlight. Hence, the solar panels installed in these directions (East/West) produce 10-20% less electricity (longer payback) than the same panels installed in the south direction.

Also, small, cluttered, scattered or oddly shaped roofs may not be an ideal place for panel installation. These problems increase the structure and the labour cost. Hence elongating the payback period of the system.
Tilt Angle of Solar Panels
The tilt of the solar panels should match the latitude of the location. Solar panels installed too flat or too steep with the roof surface affect the solar panel absorption ability and lower the energy production. This impacts the savings and results in delayed payback.
Wiring and BOS Design
Wires connect all the components of the system together and help in working in synchronization with each other. An under-sized wire may heat faster and can eventually burn out, affecting performance of the system. Hence resulting in the longer payback.
Impact of Weather Conditions on Solar Payback
High-Wind Zones
- Rooftops in cyclone- or high-wind-prone areas (e.g., coastal regions) need:
- Stronger mounting structures
- More anchoring
- Wind load-certified designs
This increases the initial cost of the structure and hence longer payback.
Heavy rainfall or snow
- Areas with heavy rainfall need:
- Elevated designs for drainage.
- Rust-proof materials (e.g., hot-dip galvanized or aluminum).
Snow zones require tilt angles for snow shedding and stronger load-bearing structures.
Extreme Heat
Metal expands and weakens over time; in very hot climates, better-quality materials are used, increasing structural cost.
| Weather Condition | Effect on Payback | Effect on Structure Cost |
| Cloudy/Rainy Climate | Less solar output → longer payback | No major structure impact (unless heavy rain) |
| High Wind | Neutral to longer payback | Higher structure cost (wind load rated) |
| Dust/Smog | More cleaning → minor delay | Neutral structure cost |
| Snowfall | Longer payback if not cleared | Higher cost for snow load design |
| Hot Climate | Neutral/slight impact | May need better materials |
For a deeper analysis of why real-world solar payback often differs from estimates, see Why Solar Payback Calculations Are Wrong by 2–3 Years.
Summary

Technical Factors:
- System Size – Larger systems cost more but can produce more electricity; oversizing can increase the payback period if not aligned with usage.
- Solar Panel Efficiency – Higher efficiency panels generate more electricity in less space, improving payback.
- Inverter Quality & Efficiency – Better inverters reduce energy losses and improve system output.
- System Degradation Rate – Slower degradation = longer high performance = quicker payback.
- Shadowing and Orientation – Shading, panel direction (south-facing in India), and tilt affect energy output and savings.
🏠 Site & Location Factors:
- Sunlight Availability (Irradiance) – More sun hours = more electricity = faster payback.
- Roof Space and Angle – Sufficient, unshaded, and properly angled roof space ensures optimal installation.
- Geographical Location – Places like Rajasthan get more sunlight than, say, Assam, which affects output.
💰 Financial Factors:
- Initial Cost of System – Higher cost = longer payback; smart component selection helps.
- Government Subsidy/Incentives – Reduce upfront cost and shorten payback.
- Electricity Tariff – Higher grid rates mean more savings per unit, thus faster payback.
- Net Metering Availability – If allowed, you can sell excess power to the grid, improving returns.
- Financing Options – Loans may increase total cost via interest, lengthening payback.
- O&M Costs – Annual maintenance costs can affect net savings.
🔋 Usage & Load Factors:
- Self-Consumption Ratio – More power used directly = higher savings.
- Load Pattern – Daytime usage matches solar generation, increasing direct use and faster payback.
Understanding these factors helps homeowners move beyond marketing payback claims and evaluate solar as a long-term financial decision rather than a short-term promise.