5-kW solar real output in February 2025
February in my place (Ghaziabad, Uttar Pradesh, India) typically experiences mild to cool weather. During this month, temperatures usually range between 10°C to 25°C.
The days are generally pleasant, with clear skies and sunny afternoons.
The solar panel performance would generally be quite good due to the moderate temperatures and the length of daylight.
Here’s an overview of the factors affecting solar panel efficiency during this month:
Sunlight
Day Length: In February, the length of daylight ranges from 11 to 12 hours. The sun rises earlier and sets later compared to the winter months, providing more time for solar panels to generate power.
Peak Sun Hours: The peak sun hours in February are usually between 11:00 AM to 3:00 PM. During these hours, the solar panels will generate the most energy, and they will be exposed to moderate to strong sunlight.
Solar Irradiance
Solar Irradiance in Ghaziabad: The average solar irradiance (amount of solar power received per unit area) in Ghaziabad during February is typically around 5 kWh/m²/day. This is a good value for solar panel performance.
The moderate temperatures in February (between 10°C to 25°C) also help in maintaining efficient performance since solar panels work better in cooler conditions compared to extreme heat.
Temperature and Efficiency
Moderate Temperature: The temperatures in February are moderate, which is beneficial because solar panels are more efficient in cooler weather. Extreme heat (like in the summer months) can cause a reduction in solar panel efficiency.
Less Dust: While air quality might be moderate to poor due to pollution, February often experiences fewer dust storms and haze compared to the peak summer months, leading to less dirt accumulation on the panels, which ensures better performance.
On a clear, sunny day, solar panels can perform optimally, generating good amounts of electricity.
A typical 1-kW residential solar panel system in Ghaziabad in February could produce anywhere from 4 to 4.5 kWh per day, depending on the system size, panel quality, installation angle, losses in the system, and the grid shutdown rate.
However, there is always a difference between the theoretical output and the real output of the system.
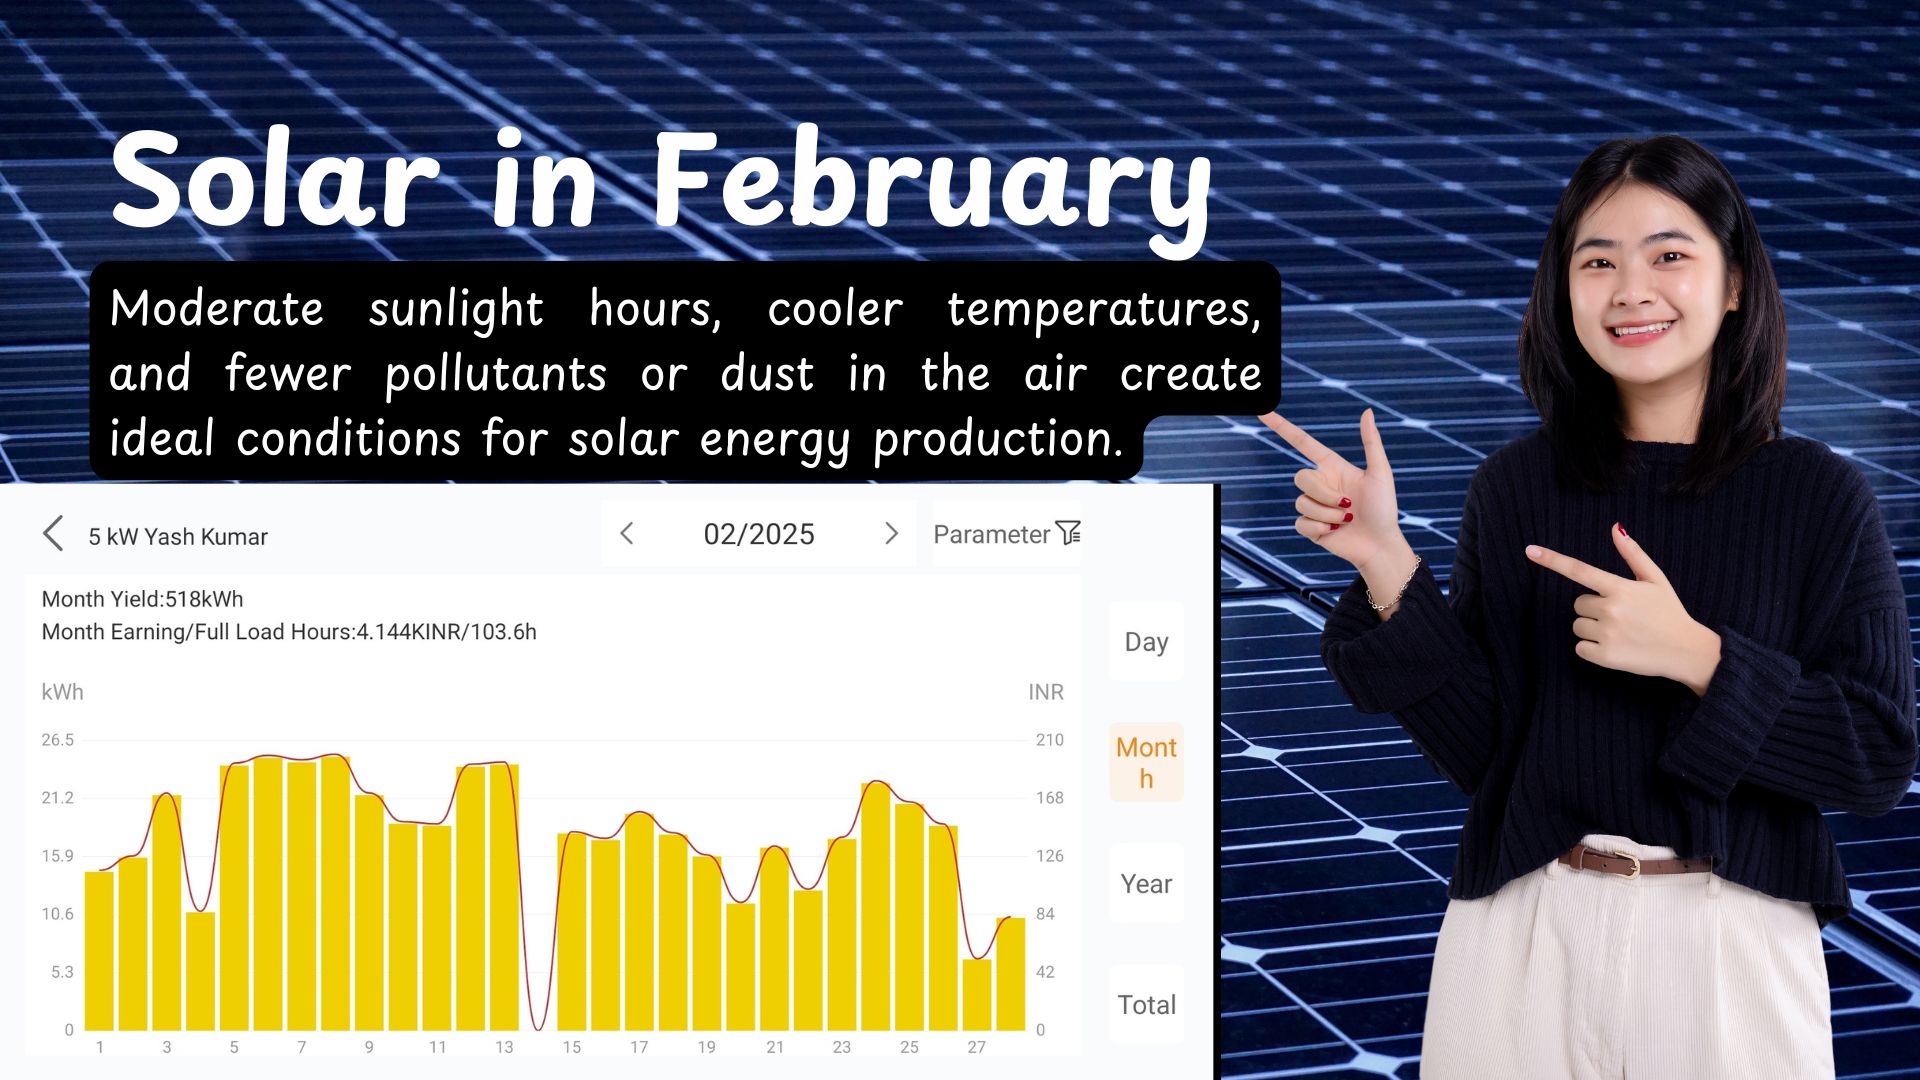
Real Output in February: 518 kWh: An Average of 3.7 kWh per day
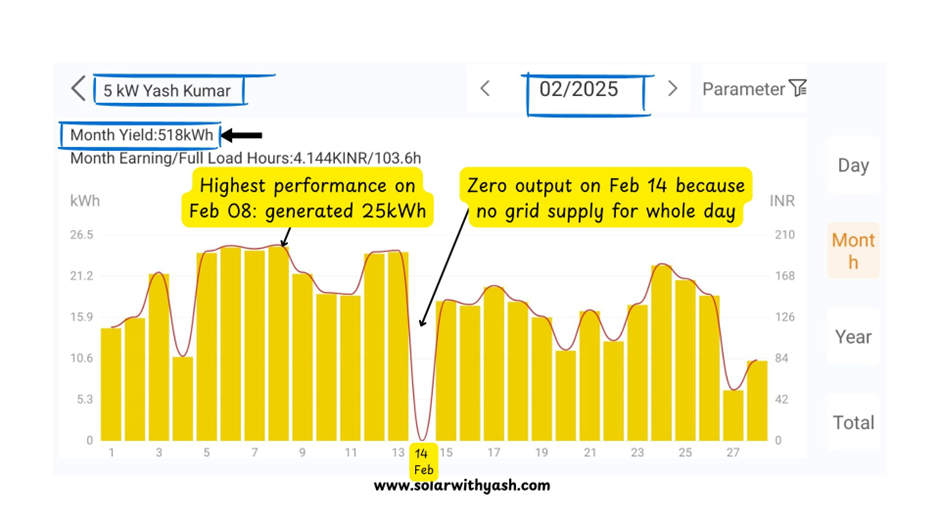
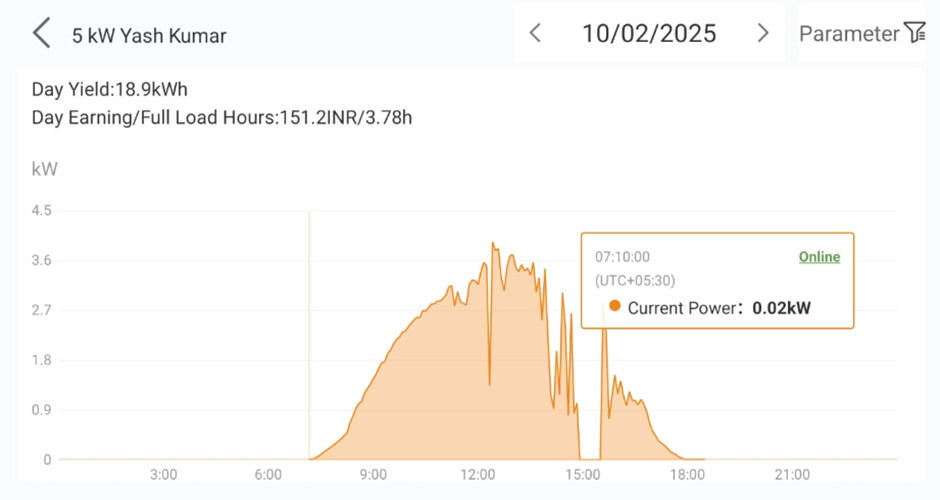
The 5-kW grid-tied solar power system produced 518 kWh in February.
Making an average of 18.5 kWh per day (518 kWh/28 days) by a 5-kW system.
February month: 28 days in 2025
This makes it 3.7 kWh per day (18.5/5) for a 1-kW solar power system.
Reasons
What factors made my 5-kW solar panel perform below average?
It is more of a grid shutdown and less of partial clouds on the following dates, which impacted the solar performance:
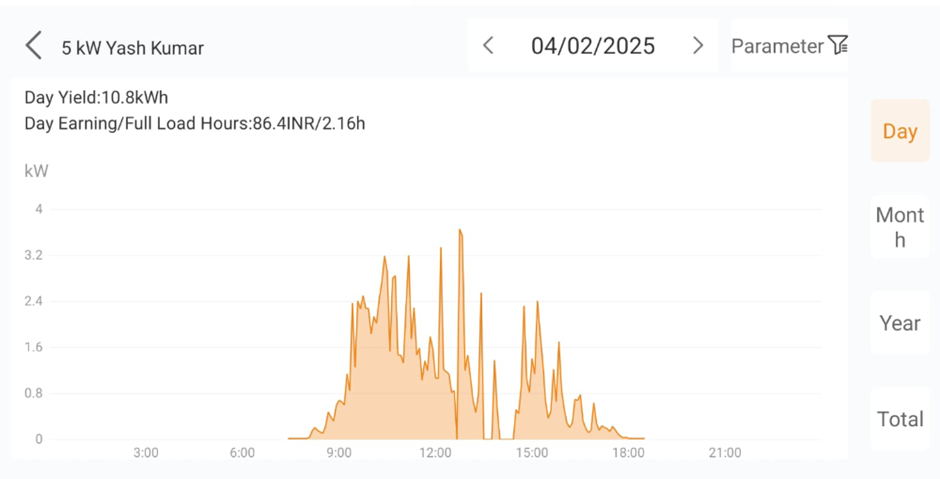
Feb 4: Partial cloud and Grid shutdown
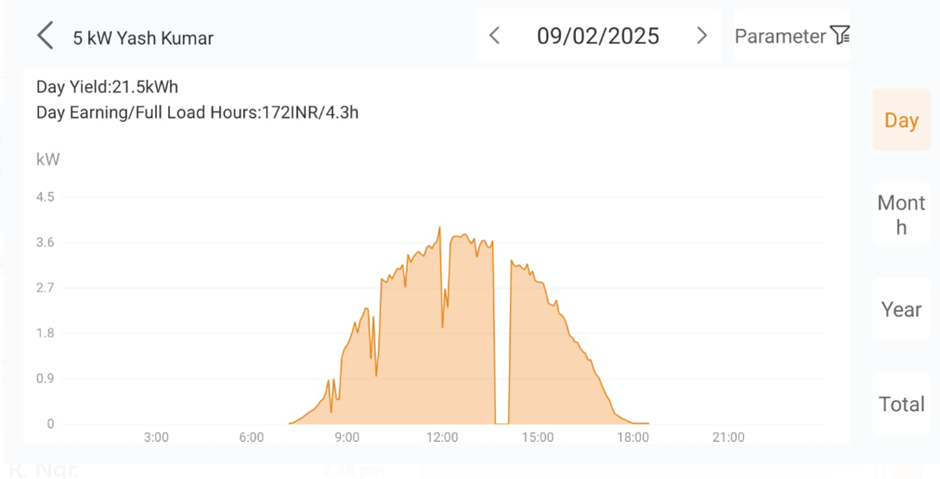
Feb 9: Grid shutdown from 13:35 to 14:05
Feb 10: Grid shutdown from 14:50 to 15:35 and partial cloudy
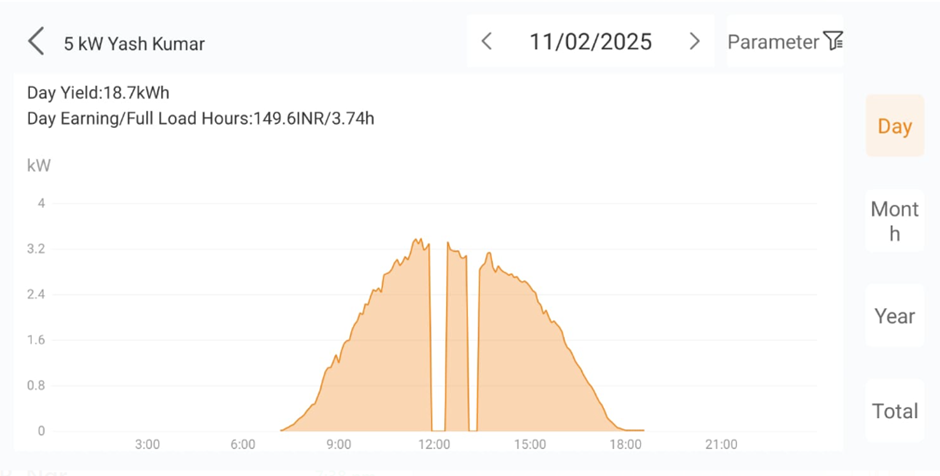
Feb 11: Grid shutdown for 50 minutes
Feb 14: NO grid throughout the day
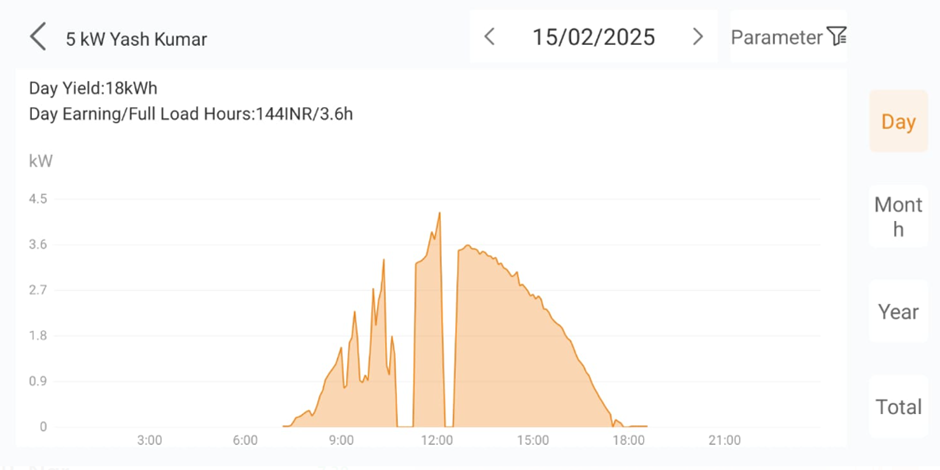
Feb 15: Grid shutdown for over 1 hour
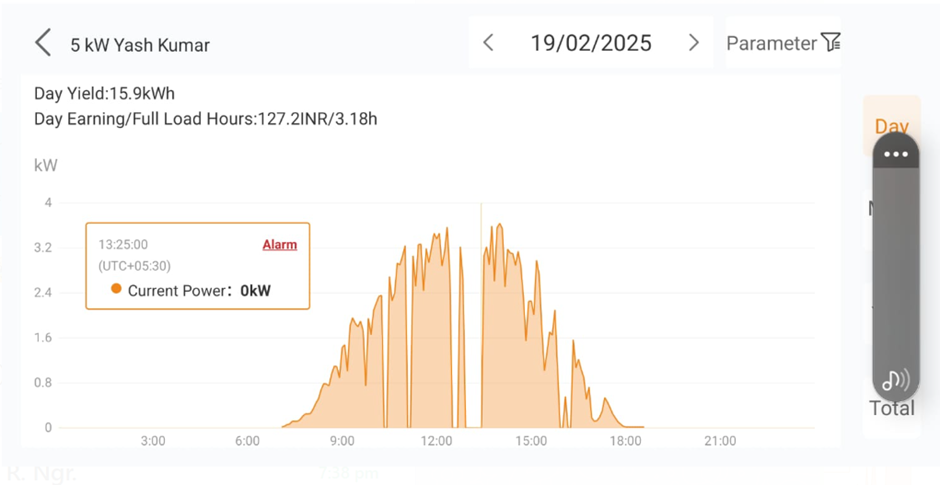
Feb 19: Grid shutdown over 1 hour and pieces of clouds
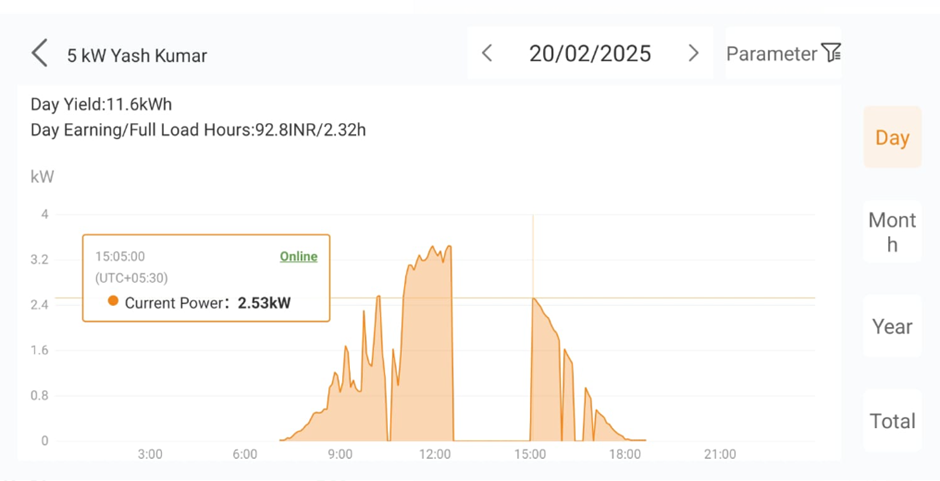
Feb 20: Grid shutdown from 12:00 to 15:05
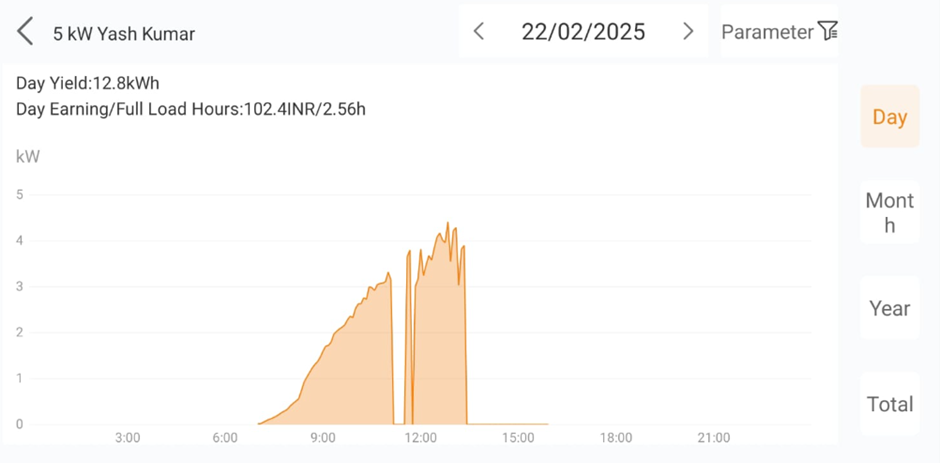
Feb 22: No grid from 13:25 till sunset
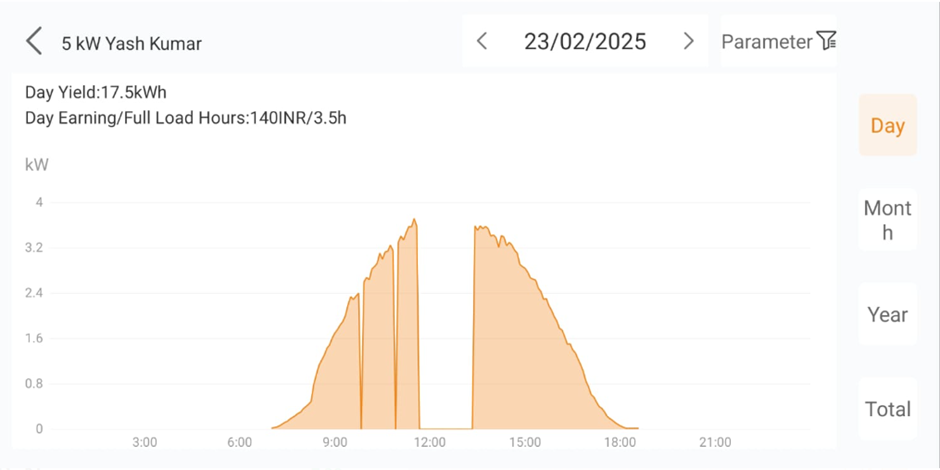
Feb 23: No grid for 2 hours
Feb 27: Cloudy
Money Saved
My 5-kW solar panel produced 518 units, saving me Rs. 4,144 (518 units x Rs. 8) in February.
1 unit = Rs. 8
Conclusion
In February, although the solar panel performance in Ghaziabad was good. It was due to a grid shutdown that affected its performance and produced below-average results.
Moderate sunlight hours, cooler temperatures, and fewer pollutants or dust in the air create ideal conditions for solar energy production.
It’s a great time to make the most of solar energy before the temperatures rise in the summer months.