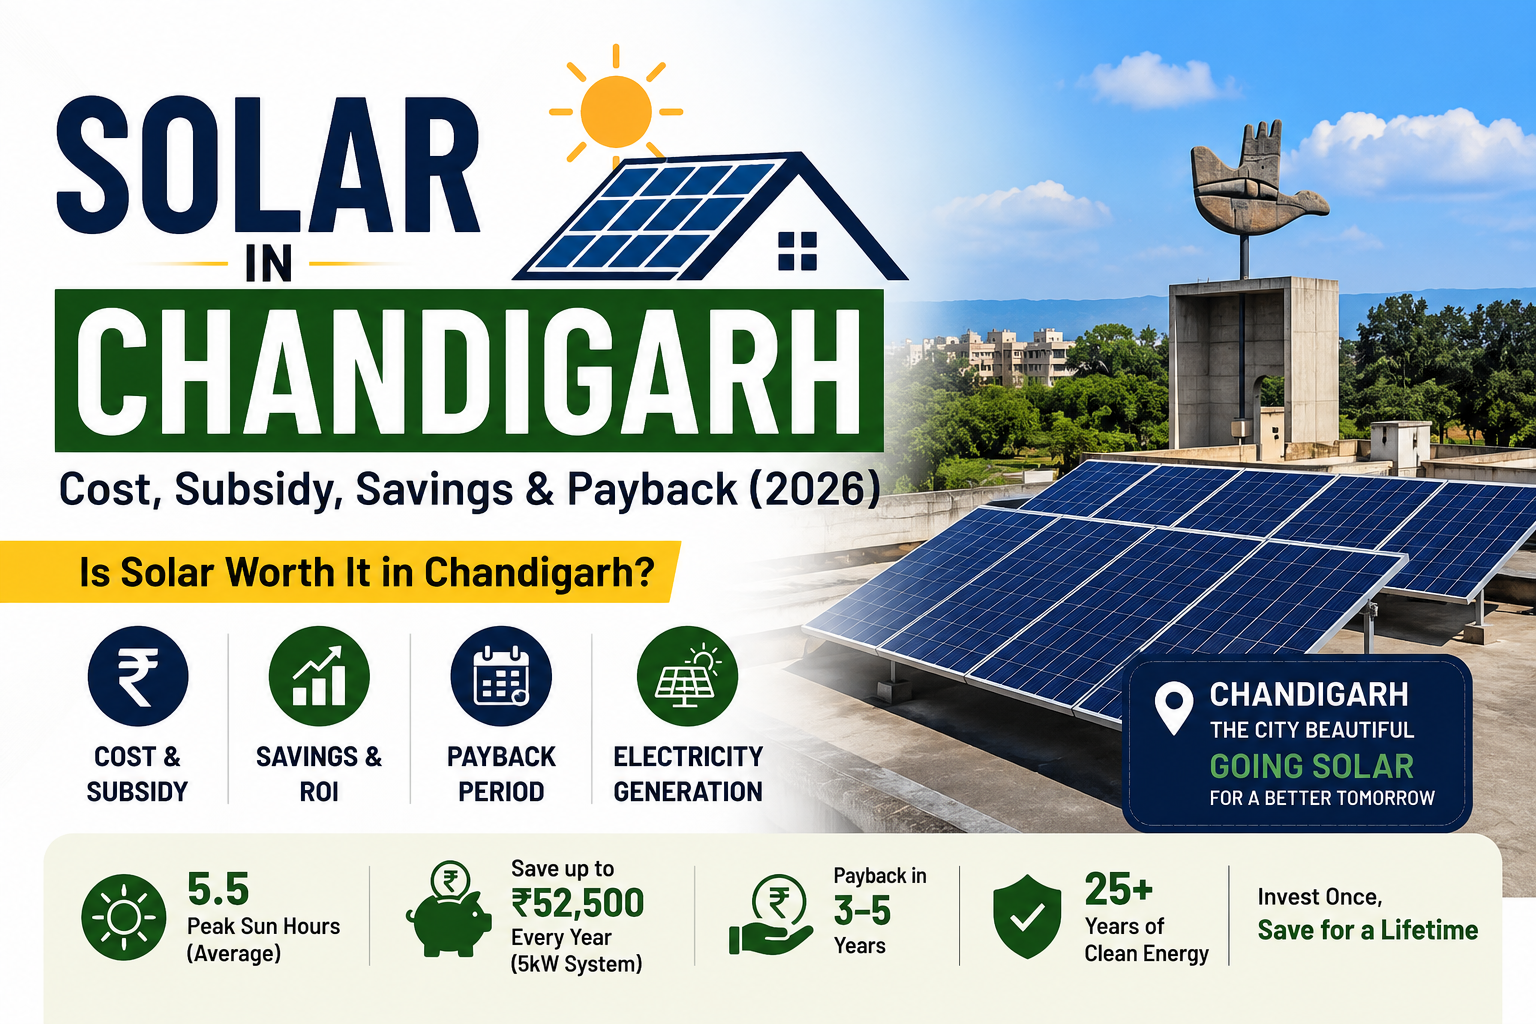
Solar in Chandigarh (2026): Cost, Savings, Subsidy and Payback Explained
Chandigarh is often called one of the most well-planned and beautiful cities in India. Wide roads, green spaces, organized sectors, and a strong focus on cleanliness make it a unique city. During my engineering days, I spent four years in Chandigarh, and one thing I noticed was that people here genuinely care about their surroundings and the environment.
That is one reason why rooftop solar can be a great fit for Chandigarh homeowners. Solar energy not only helps reduce electricity bills but also supports a cleaner and more sustainable future. In a city that values greenery and quality of life, solar power can play an important role in preserving the environment for future generations.
Apart from the environmental benefits, the financial case for solar has also become stronger. Electricity tariffs have increased significantly over the past decade, and most experts expect power prices to continue rising in the future. At the same time, government policies and net metering provisions have made rooftop solar more accessible for homeowners.
However, before investing in a solar power system, it is important to understand the numbers. How much electricity can a solar system generate in Chandigarh? How much can it save on electricity bills? What is the expected payback period? And how much money can a homeowner potentially save over the next 25 years?
In this guide, we will answer all these questions using realistic assumptions and local solar resource data, so that homeowners in Chandigarh can make an informed decision before going solar.
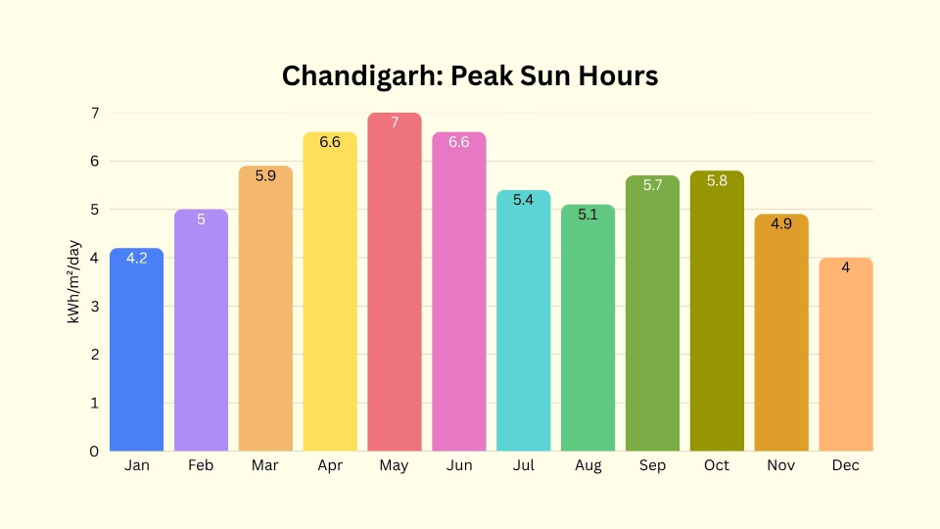
Peak Sun Hours in Chandigarh
Chandigarh receives an average Peak Sun Hours (PSH) of 5.5, with the maximum in May (7 kWh/m²/day) and the minimum in December (4 kWh/m²/day), which averages 5.5 kWh/m²/day over 12 months.
Electricity Units Generated by Solar in Chandigarh
A 1kW solar system in Chandigarh produces 1400 – 1500 units in a year, after accounting for all the losses in the system.
However, actual generation depends on roof orientation, tilt, shading, maintenance, and weather
The typical losses in any solar system installed in Chandigarh are:
- Temperature loss
- Inverter Inefficiency loss
- Dust loss
- Shading loss
- Conversion loss
- Transfer loss
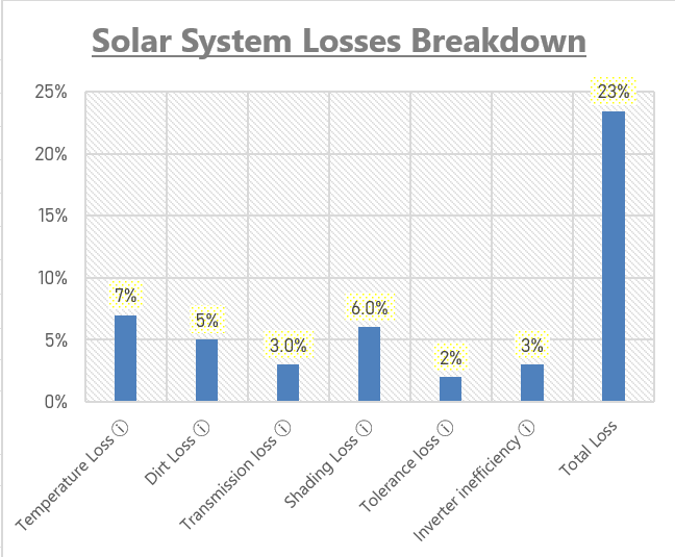
These losses can take 20% to 30% of the solar system’s production.
Annual electricity production by different solar system sizes in Chandigarh
| Solar System Size | Monthly Generation Range (Units) | Annual Generation Range (Units) |
|---|---|---|
| 1 kW | 117 – 125 | 1,400 – 1,500 |
| 2 kW | 233 – 250 | 2,800 – 3,000 |
| 3 kW | 350 – 375 | 4,200 – 4,500 |
| 4 kW | 467 – 500 | 5,600 – 6,000 |
| 5 kW | 583 – 625 | 7,000 – 7,500 |
| 6 kW | 700 – 750 | 8,400 – 9,000 |
| 8 kW | 933 – 1,000 | 11,200 – 12,000 |
| 10 kW | 1,167 – 1,250 | 14,000 – 15,000 |
Formula Used:
Annual Generation = System Size (kW) × 1400–1500 Units/year
Interested in knowing the right solar system size based on the based on your needs? Get the detailed system sizing and financial feasibility tool, “Solar Feasibility Spreadsheet (SFS – India Edition)
Solar Price in Chandigarh
A solar power system has many other components in addition to the solar panels, which make up the complete system. These are:
- Solar Inverter
- Charge controller
- ACDB and DCDB boxes with surge protection devices
- Combiner boxes
- Mounting frame and structure
- Wiring (AC and DC cables) and Conduits
- Lighting protection system with grounding
- Net meter
All these components constitute the Balance of System (BOS).
A typical 1kW solar power system in Chandigarh may cost between ₹45,000 and ₹65,000 and generates approximately 1400 to 1500 units annually. The typical market pricing can be shown as follows:
| Component | Approx. Cost (₹) |
|---|---|
| Solar Panels | 20,000 – 22,000 |
| Grid-Tied Inverter | 16,000 – 18,000 |
| Structure, Cables & Protection | 10,000 – 12,000 |
| Installation & Miscellaneous | 9,000 – 12,000 |
| Total Installed Cost | 55,000 – 65,000 |
However, the 1kW system size is usually not the most economical because the fixed cost (inverter, installation, approvals, transport, etc.) is spread over fewer watts.
Solar Subsidy in Chandigarh
The homeowner can avail the benefit of solar subsidy under the PM Surya Ghar Yojna, which further reduces the cost by a significant amount for smaller to medium-sized solar power systems.
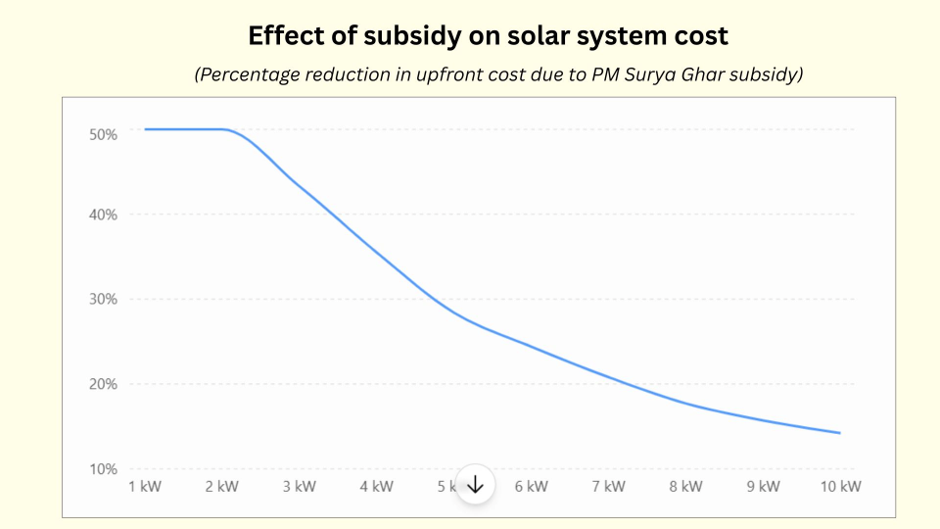
The following table gives the market price of different-sized grid-tied solar systems before and after the subsidy in 2026.
| System Size | Typical Cost Before Subsidy (₹) | Subsidy (₹) | Net Cost After Subsidy (₹) |
|---|---|---|---|
| 1 kW | 55,000 – 65,000 | 30,000 | 25,000 – 35,000 |
| 2 kW | 1,10,000 – 1,30,000 | 60,000 | 50,000 – 70,000 |
| 3 kW | 1,65,000 – 1,95,000 | 78,000 | 87,000 – 1,17,000 |
| 5 kW | 2,50,000 – 3,00,000 | 78,000 | 1,72,000 – 2,22,000 |
| 8 kW | 4,00,000 – 4,80,000 | 78,000 | 3,22,000 – 4,02,000 |
| 10 kW | 5,00,000 – 6,00,000 | 78,000 | 4,22,000 – 5,22,000 |
The table shows that the effect of the subsidy is the maximum for the first three-kilowatt system; thereafter, it starts decreasing. Reason: Once you go beyond the 3kW Solar, the subsidy remains fixed, while the system cost keeps increasing.
Annual Savings from Solar in Chandigarh
How much your solar would save in 1 year depends on the average grid electricity price per unit. For Chandigarh homeowners, a reasonable average residential value is ₹6–₹7 per unit. For payback and ROI calculations, I usually use ₹7/unit because it is easy to explain and many households consume enough electricity to justify solar in higher slabs.
Annual Savings from Solar at ₹7/unit
| Solar Size | Annual Generation (Units) | Annual Savings (₹) |
|---|---|---|
| 1 kW | 1,400 – 1,500 | 9,800 – 10,500 |
| 2 kW | 2,800 – 3,000 | 19,600 – 21,000 |
| 3 kW | 4,200 – 4,500 | 29,400 – 31,500 |
| 4 kW | 5,600 – 6,000 | 39,200 – 42,000 |
| 5 kW | 7,000 – 7,500 | 49,000 – 52,500 |
| 6 kW | 8,400 – 9,000 | 58,800 – 63,000 |
| 7 kW | 9,800 – 10,500 | 68,600 – 73,500 |
| 8 kW | 11,200 – 12,000 | 78,400 – 84,000 |
| 9 kW | 12,600 – 13,500 | 88,200 – 94,500 |
| 10 kW | 14,000 – 15,000 | 98,000 – 1,05,000 |
A clean thumb rule: In Chandigarh, every 1 kW of rooftop solar can save roughly ₹10,000 per year at an electricity rate of ₹7/unit.
Lifetime Savings from Solar
The lifetime savings can be projected as follows, based on the system size and assuming a grid price of ₹7/unit.
| Size | 25-Year Savings |
|---|---|
| 1 kW | ₹2.5 lakh |
| 3 kW | ₹7–8 lakh |
| 5 kW | ₹12–15 lakh |
| 10 kW | ₹25–30 lakh |
Curious to know the lifetime saving from solar in your region? Get the detailed financial tool, “Solar Feasibility Spreadsheet-India Edition“
Solar Payback in Chandigarh
Payback tells the homeowner how much time (in years) it takes for his system to recover the initial investment.
Payback = Initial Investment after subsidy/Annual Savings
Chandigarh offers a faster payback to its homeowners. The average payback is under 5 years for most of the system sizes.
Using the net cost after subsidy and the average annual generation of 1,450 units/kW/year with an electricity rate of ₹7/unit, we get:
Chandigarh Solar Payback Table (How solar payback changes with system size)
| Solar Size | Payback Period |
|---|---|
| 1 kW | ~3.0 Years |
| 2 kW | ~3.0 Years |
| 3 kW | ~3.3 Years |
| 4 kW | ~4.0 Years |
| 5 kW | ~3.9 Years |
| 6 kW | ~4.2 Years |
| 7 kW | ~4.3 Years |
| 8 kW | ~4.5 Years |
| 9 kW | ~4.6 Years |
| 10 kW | ~4.7 Years |
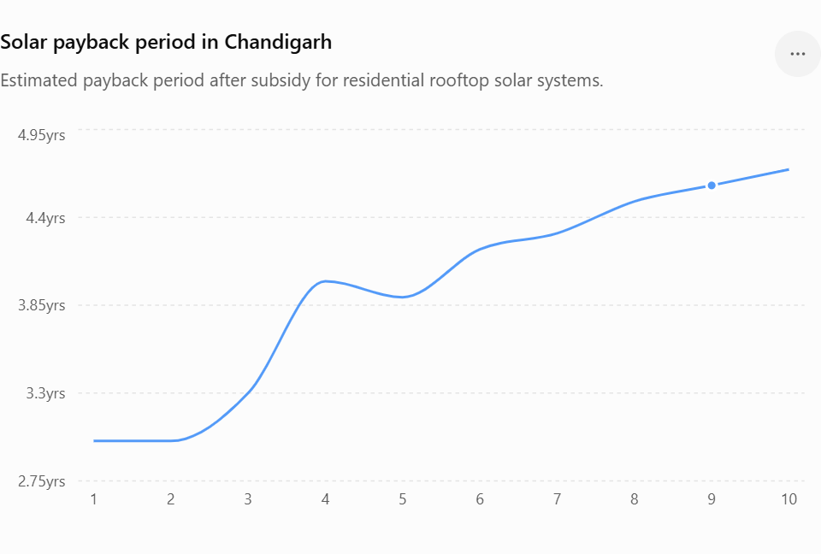
Key Takeaways:
- Fastest payback: 1–2 kW (~3 years)
- Most practical residential size: 3–5 kW (~3.3–3.9 years)
- Larger systems (6–10 kW) still offer excellent returns with paybacks below 5 years
- Since solar panels typically last 25+ years, a 10kW system with a 4.7-year payback could provide roughly 20 years of free electricity after recovering the investment
Factors that affect the payback period
The payback period that we calculated above is not fixed. It depends on the number of variables and if those variables change, the payback period is also affected.
However, the normal variations in the variables are already incorporated while calculating the payback. It is the beyond-normal variations that can further affect the solar payback values we calculated in the section above.
Let us know those variables that can affect the solar payback in Chandigarh:
(i) Peak Sun Hours
- Two families in different locations with the same energy needs may need different system sizes. It is due to the difference in the Peak Sun Hours. The family living in the region with a higher PSH often requires a smaller system size than the second family living in a region with a lower PSH value, despite having the same energy needs.
For example:
Family 1 in Chandigarh
- Energy Needs: 20 units per day
- PSH: 5.5
- System Size: 5kW
Family 2 in Kangra (Himachal Pradesh)
- PSH: 4.86
- Energy Needs: 20 units per day
- System size required: 6kW
Two families with the same energy needs, but the family with a higher PSH 5.5 (Chandigarh) requires a smaller size (5kW system) than the family living in Kangra with a PSH of 4.86, requiring 6kW.
(ii) Cost of the System
If the system cost is higher, the payback period would be longer. The system’s cost depends on the energy needs of the family. A family with higher energy needs would require a larger system. If a larger system is more costly, it also produces more units.
In that way, the payback period is not affected that much, and is almost similar to that of a smaller system producing fewer units. The payback period is affected when the system’s cost increases disproportionately.
Example
The average installation cost for a 5kW solar system is ₹50,000 to ₹60,000 for a normal roof with a continuous shade-free area.
But it may increase when the continuous shade-free area is not available, or a higher mounting structure is required to avoid the shadows of nearby trees or buildings, or if the roof is weak, then extra cementing is done to make it strong to withstand the mounting structure.
These issues may increase the overall cost by 15-20% without actually increasing the solar production. Thus, affecting the payback.
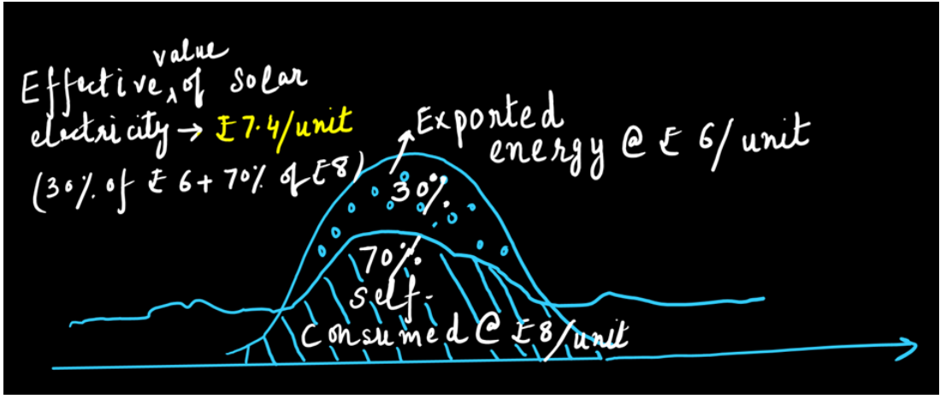
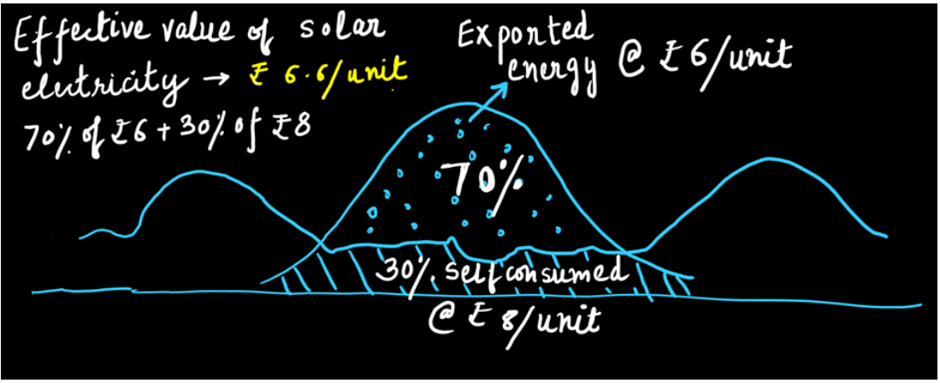
(iii) Consumption Pattern
- The energy consumption is spread throughout 24 hours. This means the homeowner and his family are using electricity continuously. However, there are times in the day when energy consumption is usually high, while at other times it’s low. When the family consumes most of the solar electricity for itself and exports less, then it usually improves the effective monetary value of the solar units and makes the payback faster. While exporting more units in the daytime rather than consuming for itself, reduces the effective solar electricity monetary value and stretches the payback.
These differences arise due to the differences in the grid import rate and the solar export rate.
Let us understand with an example:
- Import electricity rate = ₹8/unit
- Export rate = ₹6/unit
- Same solar system
- Same location
- Same annual solar generation
Now look at two families.
Family A: High Daytime Usage
- Self-consumes 70% of solar generation
- Exports 30%
- Effective Value of Solar Electricity: ₹7.4/unit
Family B: Low Daytime Usage
- Self-consumes only 30%
- Exports 70%
- Effective Value of Solar: ₹6.6/unit
(iv) Grid Price
Although the sizing of any solar system is based on the average units consumed by the family. But the monetary value of those generated solar units is based on the grid price. If two similar-sized systems are installed at two different locations. The place with a higher grid price will have more monetary savings than the one with a lower grid price for the same unit generated.
Are you planning to go solar? Before that, size, design, and find the financial feasibility of your solar power system using “Solar Feasibility Spreadsheet-India Edition”
Case Study: 8kW Solar for Mr. Singh and Family, Sector 44, Chandigarh
Mr. Singh, a homeowner in Sector 44, Chandigarh, was looking to reduce his rising electricity bills, which averaged around ₹6,000 per month. After evaluating his annual consumption, available roof space, and future plans to add an electric vehicle, an 8kW rooftop solar system was recommended. The larger system size was chosen not only to offset current consumption but also to accommodate future electricity demand. The system details are as follows:
- Location: Chandigarh, Sector-44
- Recommended System size: 8kW
- Net Cost: 3.95 lakhs
- Expected units generation per month: 900 – 950 units
- Expected payback: 5 years
Since Mr. Singh has installed the system, 6 months have already passed, and since then, his system has saved him over ₹38,000. It is expected that the family will recover its cost in 5 years.
When asked about his experience with Solar, Mr. Singh said,” I feel it is one of the best investments so far that I have made in energy. A ₹38,000 savings in 6 months means over 19% annual return on my investment. Even better than almost all financial instruments I have seen so far. Solar not only provides electricity but is also a great financial asset. I recommend everyone to have this financial asset.”
Readers might be interested in knowing,” Solar vs Fixed Deposit: Which Gives Better Returns in India (2026)?
Tips for Homeowners in Chandigarh
Here are a few tips for Chandigarh homeowners who are planning to go solar in 2026.
Calculate Your Solar Payback First:
Calculate expected savings, payback period, and lifetime ROI based on your electricity bill and consumption pattern.
Choose an Experienced Installer, Not the Cheapest One
A slightly more expensive installer with a proven track record is often a better investment than the lowest quote. Ask for local installations you can visit.
Inspect Your Roof Yourself
Measure the available roof area. Identify any water tanks, staircases, or obstructions.
Check for Shading Throughout the Day
Trees, neighbouring buildings, mobile towers, and overhead structures can significantly reduce solar generation. Observe the roof during morning, noon, and afternoon hours.
Think About Future Electricity Needs
Planning to buy an EV? Adding new ACs next summer? Future consumption can justify a larger system today.
Understand Your Consumption Pattern
Solar works best when a good portion of electricity is used during the day. If most consumption happens at night, savings may be lower than expected.
Replace Very Old Appliances Before Sizing Solar
Old ACs, refrigerators, pumps, and geysers can consume significantly more electricity. Improving efficiency first may reduce the solar system size you actually need.
Understand Net Metering Rule
Before signing any agreement, understand how exported electricity is credited and what limitations may apply. Rules and procedures continue to evolve under the rooftop solar framework.
Don’t Oversize the System Just to Get Bigger Savings Numbers
Bigger systems do not automatically mean better ROI. Size the system according to present and reasonably expected future consumption.
Use at Least 12 Months of Electricity Bills
One month’s bill can be misleading. Seasonal variations in Chandigarh can be significant due to AC usage in summer and heating loads in winter.
Take Advantage of Available Subsidies
Residential consumers can still avail PM Surya Ghar benefits, with subsidy support available up to 3 kW-equivalent eligibility limits under current rules.
Final Tip
Treat solar as a 25-year financial decision, not as a solar panel purchase.
The homeowners who are happiest after installation are usually the ones who spend the most time understanding their consumption, roof, future plans, and payback before signing the contract.

Is Solar Worth it in Chandigarh in 2026
Short Answer: Yes.
Chandigarh receives good Peak Sun Hours of 5.5, making it an attractive place for Solar. Also, the rising grid prices and government support for solar through net-metering and subsidies make it one of the best energy investments in 2026. A residential grid-tied solar system in Chandigarh has the potential to save lakhs of rupees in its lifetime with a payback under 5 years.
However,homeowners should decide on their system size based on their consumption pattern and energy needs.
FAQ
1. What is the solar payback in Chandigarh?
The average solar payback in Chandigarh is under 5 years. However, it depends on the consumption pattern of the homeowner and their maintenance behaviour.
2. How many units does a 1kW solar system generate in Chandigarh?
A 1kW solar system in Chandigarh generates between 1,400 and 1,500 units per year after accounting for losses.
3. What is the cost of solar in Chandigarh?
The average cost of solar in Chandigarh is ₹55,000 – ₹65,000 before subsidy.
4. What is the right tilt for solar in Chandigarh?
For Chandigarh’s latitude of approximately 30.7° North, a tilt angle of around 30° facing south is generally considered optimal for maximizing annual solar energy generation.
5. How much area does a solar power system cover on the roof?
| Solar Size | Roof Area Required |
| 1 kW | 80–100 sq ft |
| 3 kW | 240–300 sq ft |
| 5 kW | 400–500 sq ft |
| 10 kW | 800–1000 sq ft |