How Much Money Can Solar Panels Save in the US? (2026 Realistic Analysis)
A typical homeowner’s savings in the USA are approximately $1,236 annually from a standard 5 kW residential solar system. Over a 25-year system lifetime, the average homeowner can potentially achieve around $13,700 in net savings even after accounting for installation costs, regular maintenance, inverter replacements, and repair expenses.
However, solar savings are far from uniform across the country. The actual financial return from rooftop solar depends heavily on several factors, including the state or county you live in, local electricity prices, solar irradiance (peak sun hours), available federal and state incentives, system size, self-consumption percentage, export compensation rates, roof conditions, and long-term system degradation.
While some homeowners in high-electricity-price states like California or Hawaii can save tens of thousands of dollars more than the national average, homeowners in lower-electricity-price states may experience more moderate returns.
In this guide, we will explore the key factors that affect residential solar savings in the USA, identify the best states for rooftop solar based on incentives, sunlight availability, annual savings, and long-term returns, and discuss the most common mistakes homeowners make while going solar — along with practical ways to avoid them.
What determines solar savings?
As discussed earlier, the total savings from a residential solar system are influenced by several factors before arriving at the final financial return. While many homeowners focus only on the system size or installation cost, the actual economics of rooftop solar depend on a combination of electricity prices, solar irradiance, incentives, self-consumption patterns, export compensation, and long-term system performance. Let us understand each factor one by one.
Curious to know your Solar Savings and the Right System Size?
Get My Free Tool Solar Snap
1. Electricity Tariff
One of the most important factors affecting solar savings is the residential electricity tariff — the price homeowners pay per unit (kWh) of electricity consumed from the grid. The higher the electricity rate, the more expensive grid power becomes, and therefore, the more valuable rooftop solar becomes.
When a homeowner installs a solar system, the solar electricity generated during the daytime starts replacing electricity that would otherwise have been purchased from the utility company. As a result, the states with higher residential electricity prices typically provide much higher solar savings and faster payback periods compared to states with lower electricity prices.
For example, if a homeowner pays 40 cents/kWh for grid electricity, then every unit of solar electricity generated effectively saves 40 cents.
However, if another homeowner pays only 12 cents/kWh, the same solar generation produces much lower financial savings despite identical solar production. This is one of the main reasons why residential solar adoption is especially strong in high-electricity-price states such as California, Hawaii, Massachusetts, and New York.
Top 10 U.S. States with the Highest Residential Electricity Rates (2025)
| Rank | State | Avg Residential Electricity Rate |
|---|---|---|
| 1 | Hawaii | 40.2¢/kWh |
| 2 | California | 31.9¢/kWh |
| 3 | Massachusetts | 31.2¢/kWh |
| 4 | Rhode Island | 30.8¢/kWh |
| 5 | Maine | 27.9¢/kWh |
| 6 | New Hampshire | 27.4¢/kWh |
| 7 | Connecticut | 27.0¢/kWh |
| 8 | New York | 26.5¢/kWh |
| 9 | Alaska | 26.2¢/kWh |
| 10 | Vermont | 24.2¢/kWh |
As visible from the table, most of the states with the highest residential electricity prices are located in the Northeast and West Coast regions. Homeowners in these states generally achieve significantly higher long-term savings from rooftop solar systems because each unit of solar electricity offsets very expensive grid electricity.
References:
https://utilitycheck.co/data/electricity-rates-by-state
EIA Electric Power Monthly – Average Price by State
2. Solar Irradiance
Another major factor that determines residential solar savings is solar irradiance — the amount of solar energy received by the solar panels from sunlight. The electricity output of a solar system is directly proportional to the amount of sunlight falling on the panels. Higher sunlight exposure means higher electricity generation and, therefore, higher savings.

Solar panels generate electricity using photovoltaic (PV) cells. When sunlight falls on the solar panel surface, some of the light is reflected, some passes through, and some is absorbed by the semiconductor cells inside the panel. The absorbed photons excite electrons within the solar cells, generating an electric current that is converted into usable electricity.
Because solar generation depends heavily on sunlight availability, states with higher solar irradiance generally produce more electricity from the same solar system size.
For example, a 5kW rooftop solar system installed in Arizona will generate significantly more electricity annually than the same 5 kW system installed in Washington or Maine.
One of the most commonly used metrics for measuring solar potential is Peak Sun Hours (PSH). Peak Sun Hours represent the equivalent number of hours per day during which solar irradiance averages 1,000 W/m².
In simple terms, higher peak sun hours mean higher solar energy production.
The top 10 U.S. states with the highest average Peak Sun Hours (PSH):
| Rank | State | Avg Peak Sun Hours / Day |
|---|---|---|
| 1 | Arizona | 6.68 |
| 2 | New Mexico | 6.49 |
| 3 | Nevada | 6.23 |
| 4 | Hawaii | 5.97 |
| 5 | Colorado | 5.85 |
| 6 | California | 5.75 |
| 7 | Wyoming | 5.53 |
| 8 | Utah | 5.51 |
| 9 | Idaho | 5.48 |
| 10 | Oklahoma | 5.41 |
As visible from the table, the Southwestern states dominate the list due to their dry climate, lower cloud cover, and higher annual sunshine duration. Homeowners in these states can generate substantially more electricity from the same rooftop solar system compared to states with lower solar irradiance.
For example, A 5kW solar system in Arizona may generate over 9,000 kWh annually,
while the same system in northern states may generate only around 5,500–6,500 kWh annually.
This difference in solar generation directly impacts annual savings, payback period, and long-term return on investment.
References:
National Renewable Energy Laboratory (NREL) NSRDB database
https://solarstory.com/sunlight-hours-by-state/
3. Net Metering
Net metering is one of the most important policies that improves the financial returns of residential rooftop solar systems in the United States. It is a billing mechanism available in many grid-tied solar systems that allows homeowners to receive credit for excess solar electricity exported to the utility grid.
A grid-tied solar system uses a bi-directional electricity meter, which allows electricity to flow in two directions: from the grid to the house, and from the solar system back to the grid.
During the daytime, when the solar panels are generating electricity, the home first consumes the solar power directly. If the solar system produces more electricity than the house is currently consuming, the excess electricity is automatically exported to the utility grid through the bi-directional meter.
At night or during cloudy periods when the solar system is not generating sufficient electricity, the home imports electricity from the grid. In this way, the combination of the utility grid and the solar power system helps in maintaining an uninterrupted 24-hour electricity supply to the house.
Under net metering programs, homeowners receive credits for the excess electricity they export. These credits are then used to offset future electricity consumption from the grid. The exact compensation structure depends heavily on the state, utility company, and local regulations.
In states with strong net metering policies, exported solar electricity may be compensated close to the retail electricity rate, significantly improving solar savings and reducing payback periods.
However, some states have transitioned toward “net billing” structures, where exported electricity is compensated at lower wholesale or avoided-cost rates.
Therefore, homeowners living in states with favorable net metering policies generally achieve:
- higher annual savings,
- better long-term returns,
- and faster solar payback periods.
U.S. States with Favorable Residential Net Metering Policies
Some states known for strong or historically favorable residential net metering programs include:
| State | Net Metering Status |
|---|---|
| California | Available (varies by utility under NEM programs) |
| New York | Strong statewide net metering policies |
| New Jersey | Favorable residential net metering |
| Massachusetts | Strong solar compensation structure |
| Connecticut | Residential net metering available |
| Maryland | Statewide net metering support |
| Rhode Island | Favorable residential solar compensation |
| Arizona | Available with utility-specific structures |
| Nevada | Net metering with revised export rates |
| Colorado | Strong distributed solar policies |
References
DSIRE – Net Metering Policies by State
U.S. Department of Energy – Net Metering Overview
4. Self- Consumption Percentage
Another important factor that affects the payback period and long-term savings of a residential solar system is the homeowner’s electricity consumption pattern and self-consumption percentage.
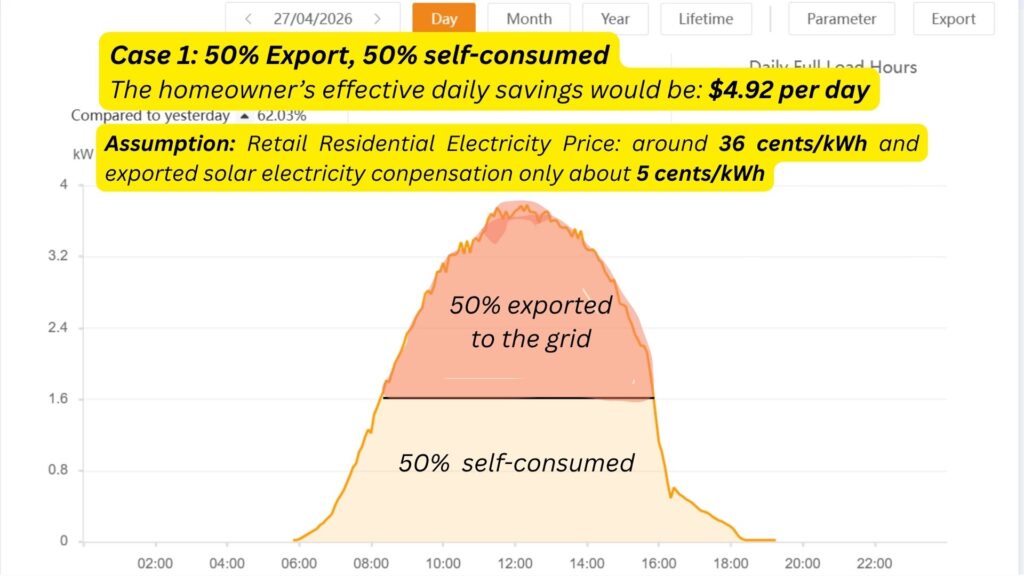
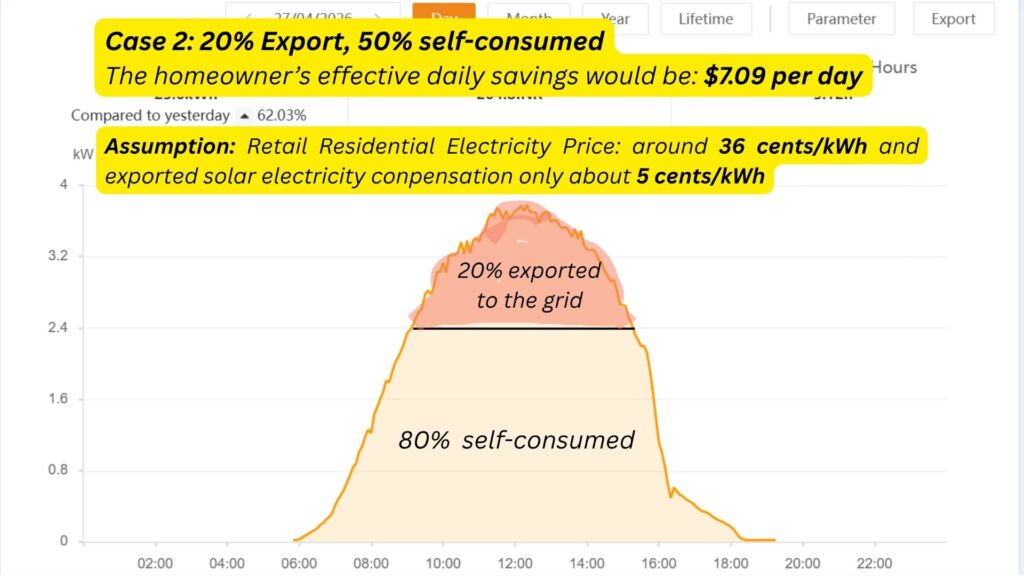
Consider a homeowner in Orange County, California, served by Southern California Edison (SCE), installing a 5kW rooftop solar system that generates around 24 kWh of electricity per day.
If the homeowner directly consumes only 50% of the solar generation during the daytime, then 12 kWh is self-consumed while the remaining 12 kWh is exported to the grid.
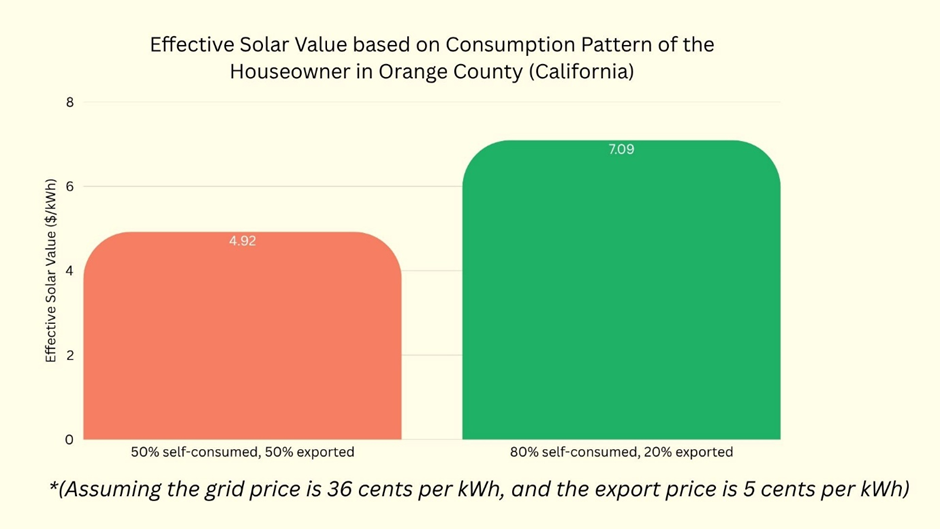
Under California’s NEM 3.0 structure, retail residential electricity may cost around 36 cents/kWh, while exported solar electricity may receive only about 5 cents/kWh in compensation. In this case, the homeowner’s effective daily savings would be:
(12 × $0.36) + (12 × $0.05) = $4.92 per day.
Now consider another homeowner in the same utility territory with a similar 5 kW system, but who self-consumes 80% of the solar energy generated. This homeowner directly uses about 19 kWh and exports only 5 kWh to the grid. The effective daily savings would then become: (19 × $0.36) + (5 × $0.05) = $7.09 per day.
This is nearly 44% higher savings compared to the homeowner who self-consumes only 50% of the solar generation.
Over the lifetime of the system, this difference can significantly impact the total savings, return on investment, and payback period.
Many solar payback calculations assume exported units equal imported electricity. Know how it affects your savings in my guide, “Why Exported Solar Units Are Often Overvalued (And How It Changes Your Real Payback).”
5. Degradation
Like any other electrical or mechanical system, a residential solar power system also experiences performance degradation over time. Solar panels, inverters, wiring, and other system components gradually lose efficiency as they age and are exposed to environmental conditions such as heat, humidity, UV radiation, dust, snow, and thermal cycling.
Among all components, solar panel degradation is one of the most important factors affecting the long-term electricity generation and savings of a rooftop solar system.
Solar panels do not suddenly stop working after a certain number of years. Instead, their electricity generation capacity slowly declines over time. Most solar panels experience:
a slightly higher degradation during the first year, followed by a slower and more stable degradation rate during the remaining operational life.
Typically:
- Solar panels may degrade by around 1–3% during the first year,
- And then continue degrading at approximately 0.4–0.6% per year afterward until the 25th year.
As a result, a solar panel installed today may still operate at:
- around 80–90% of its original capacity after 25 years, depending on the technology and manufacturing quality.
Since annual solar generation gradually decreases with time, degradation directly affects long-term electricity generation and total lifetime savings.
The general degradation can be shown as follows (to make you visually understand the concept):
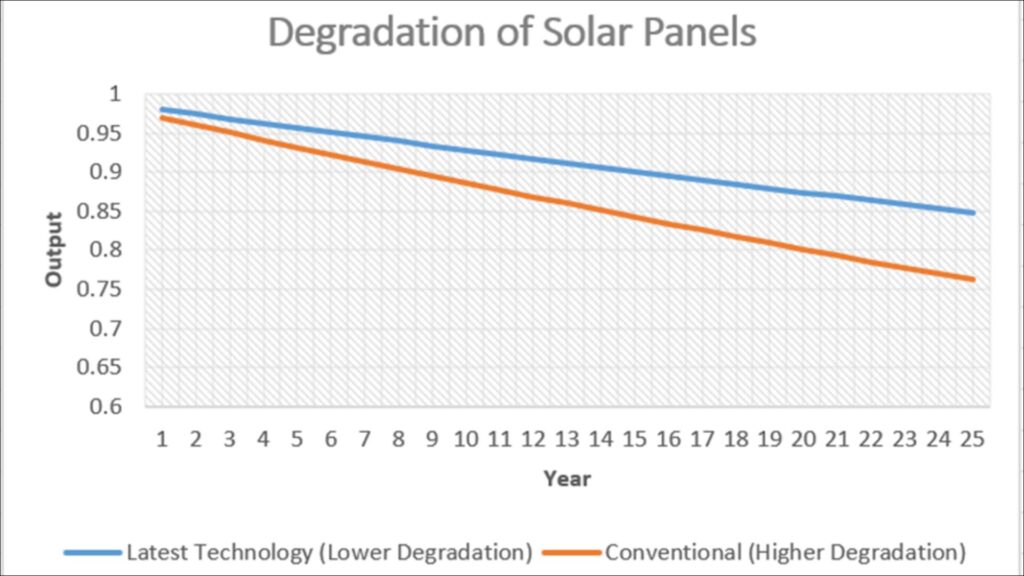
Solar Panel Technology Matters
The degradation rate varies significantly depending on the solar panel technology used. Modern high-efficiency solar technologies generally degrade at a much slower rate than older conventional technologies.
Advanced technologies such as:
- Mono PERC (Passivated Emitter Rear Contact),
- Half-cut cell solar panels,
- TOPCon solar panels,
- HJT (Heterojunction Technology)
Although premium technologies may have a slightly higher upfront cost, they often provide higher lifetime savings due to better long-term performance.The table below shows the typical degradation of different types of solar panels. The homeowners can choose based on their requirements:
| Solar Panel Technology | Typical First-Year Degradation | Annual Degradation After Year 1 | Estimated Capacity After 25 Years |
|---|---|---|---|
| Polycrystalline | 2–3% | 0.7–0.8% | ~78–80% |
| Conventional Monocrystalline | 2% | 0.5–0.7% | ~80–83% |
| Mono PERC | 1.5–2% | 0.45–0.55% | ~84–86% |
| Half-Cut Mono PERC | 1.5–2% | 0.4–0.5% | ~85–87% |
| TOPCon | ~1% | 0.35–0.45% | ~87–89% |
| HJT (Heterojunction) | ~1% | 0.25–0.35% | ~88–92% |
6. Incentives
Homeowners in the U.S. can significantly reduce the cost of rooftop solar installations through a combination of federal, state, utility, and local incentives. Here are the major residential solar incentives currently available in the United States:
i) Federal Residential Clean Energy Credit (30% Tax Credit)
The biggest nationwide incentive is the federal solar tax credit, officially called the Residential Clean Energy Credit.
Key benefits:
- Homeowners can claim 30% of the total solar installation cost as a federal tax credit.
- Applies to:
- Solar panels
- Inverters
- Battery storage
- Installation labor
- Wiring and permitting
- Available for both primary and secondary homes in the U.S.
- Unused credit can usually be carried forward to future tax years.
Example:
If a solar system costs $25,000
Then the homeowner may receive: $7,500 (30% of $25,000) federal tax credit
Reducing the effective system cost to: $17,500 ($25,000 – $7,500)
ii) State Solar Tax Credits
Some states offer additional state-level income tax credits in addition to the federal incentive.
Examples:
- New York offers up to 25% state tax credit (capped).
- South Carolina offers state solar tax credits.
- Arizona offers residential solar tax credits.
These can often be stacked with the federal 30% credit.
Best States for Residential Solar Incentives in the USA
Some of the strongest overall residential solar incentive markets currently include:
| State | Why Attractive |
|---|---|
| California | High electricity prices + battery incentives |
| New York | Strong tax credits + NYSERDA programs |
| Massachusetts | High utility rates + SMART incentives |
| New Jersey | Strong Solar Renewable Energy Certificate (SREC) market |
| Arizona | Excellent solar resource + tax benefits |
| Texas | High solar production + property tax exemption |
| Florida | Property & sales tax exemptions |
Ref: https://www.irs.gov/credits-deductions/residential-clean-energy-credit
6. Annual Maintenance and Equipment Replacement Cost
Another important factor homeowners often ignore while calculating solar savings is the long-term maintenance and equipment replacement cost of the solar power system.
Although residential solar systems require relatively low maintenance, they are not completely maintenance-free. Periodic cleaning, inspections, electrical checks, and minor repairs may still be required over the system’s lifetime. Ignoring these expenses can inflate the estimated savings and make the payback period appear shorter than it actually is.
One of the most significant long-term expenses is inverter replacement. While solar panels commonly last 25–30 years, most residential string inverters typically last around 10–15 years and may require at least one replacement during the system’s lifetime. In addition, homeowners may occasionally incur costs related to roof sealing, waterproofing, corrosion treatment, mounting hardware maintenance, and minor electrical repairs.
Including these maintenance and replacement costs provides a more realistic estimate of the actual payback period and long-term savings of a residential solar system.
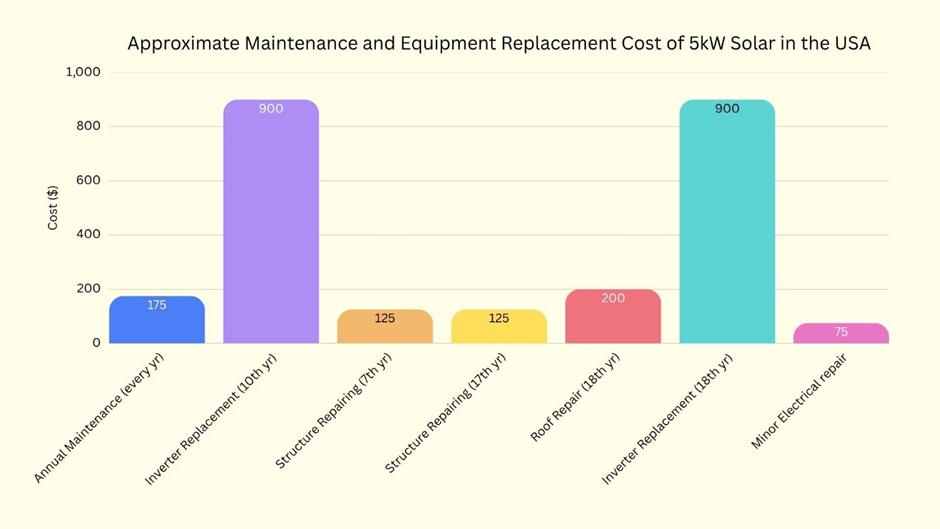
A typical annual maintenance cost and equipment replacement cost of a 5kW solar system in the USA.
Annual Savings By State in the USA
Let us now evaluate how much a homeowner can realistically save from a standard 5 kW grid-tied rooftop solar system in different states across the United States.
Assumptions Used in the Calculations
| Parameter | Assumption |
|---|---|
| Solar system size | 5 kW |
| System type | Grid-tied rooftop solar |
| Average installed cost before incentives | $15,000 |
| Federal solar tax credit | 30% |
| Net installed cost after incentives | ~$10,500 |
| Solar panel degradation | ~2% first year, then ~0.5% annually |
| Inverter replacement | One replacement during system lifetime |
| System lifetime | 25 years |
| Performance ratio | ~75–80% |
| Maintenance & repair cost | Included |
| Electricity rates | State residential averages |
| Solar generation | Based on state peak sun hours |
USA Solar Residential Solar Economics by State
The table below provides an approximate comparison of all 50 U.S. states based on:
- Average residential electricity rate for homeowners consuming around 500–600 kWh/month
- Estimated Annual Savings ($/yr) = Annual Solar Generation × Residential Electricity Rate
| State | Avg Residential Electricity Rate ($/kWh) | Estimated Annual Generation from 5 kW Solar (kWh/year) | Estimated Annual Savings ($/year) |
|---|---|---|---|
| Alabama | 0.16 | 7,200 | 1,152 |
| Alaska | 0.26 | 5,200 | 1,352 |
| Arizona | 0.15 | 9,400 | 1,410 |
| Arkansas | 0.14 | 7,100 | 994 |
| California | 0.32 | 8,200 | 2,624 |
| Colorado | 0.15 | 8,600 | 1,290 |
| Connecticut | 0.27 | 6,800 | 1,836 |
| Delaware | 0.18 | 6,900 | 1,242 |
| Florida | 0.15 | 7,900 | 1,185 |
| Georgia | 0.14 | 7,600 | 1,064 |
| Hawaii | 0.40 | 8,700 | 3,480 |
| Idaho | 0.11 | 8,000 | 880 |
| Illinois | 0.17 | 6,700 | 1,139 |
| Indiana | 0.16 | 6,400 | 1,024 |
| Iowa | 0.15 | 6,900 | 1,035 |
| Kansas | 0.15 | 7,500 | 1,125 |
| Kentucky | 0.13 | 6,500 | 845 |
| Louisiana | 0.13 | 7,300 | 949 |
| Maine | 0.28 | 6,000 | 1,680 |
| Maryland | 0.18 | 6,700 | 1,206 |
| Massachusetts | 0.31 | 6,200 | 1,922 |
| Michigan | 0.19 | 6,000 | 1,140 |
| Minnesota | 0.16 | 6,100 | 976 |
| Mississippi | 0.14 | 7,000 | 980 |
| Missouri | 0.14 | 6,900 | 966 |
| Montana | 0.13 | 7,300 | 949 |
| Nebraska | 0.12 | 7,000 | 840 |
| Nevada | 0.17 | 8,900 | 1,513 |
| New Hampshire | 0.27 | 6,100 | 1,647 |
| New Jersey | 0.20 | 6,600 | 1,320 |
| New Mexico | 0.14 | 9,100 | 1,274 |
| New York | 0.26 | 6,200 | 1,612 |
| North Carolina | 0.14 | 7,100 | 994 |
| North Dakota | 0.12 | 6,600 | 792 |
| Ohio | 0.16 | 6,300 | 1,008 |
| Oklahoma | 0.13 | 7,800 | 1,014 |
| Oregon | 0.14 | 6,100 | 854 |
| Pennsylvania | 0.18 | 6,300 | 1,134 |
| Rhode Island | 0.31 | 6,300 | 1,953 |
| South Carolina | 0.15 | 7,300 | 1,095 |
| South Dakota | 0.13 | 6,800 | 884 |
| Tennessee | 0.14 | 6,800 | 952 |
| Texas | 0.16 | 8,200 | 1,312 |
| Utah | 0.12 | 8,500 | 1,020 |
| Vermont | 0.24 | 5,900 | 1,416 |
| Virginia | 0.15 | 6,900 | 1,035 |
| Washington | 0.12 | 5,700 | 684 |
| West Virginia | 0.14 | 6,100 | 854 |
| Wisconsin | 0.18 | 5,800 | 1,044 |
| Wyoming | 0.13 | 8,400 | 1,092 |
States with the Highest Solar Savings Potential
The best residential solar economics generally occur in states that combine:
- high electricity prices,
- strong solar irradiance,
- and favorable net metering or export compensation.
Top performers include:
- California
- Hawaii
- Massachusetts
- Rhode Island
- Nevada
- Arizona
States with Excellent Solar Production
States with the highest solar generation potential from a 5 kW system include:
- Arizona
- New Mexico
- Nevada
- Utah
- Colorado
- Wyoming
These states benefit from high peak sun hours and dry climates.
States with Lower Savings Despite Good Sunlight
Some states receive excellent sunlight but still have moderate savings because residential electricity prices are relatively low. Examples include:
- Texas
- Oklahoma
- Utah
- Idaho
States with Strong Savings Due to High Grid Prices
Some northeastern states have modest solar generation but still achieve strong savings because grid electricity is expensive. Examples include:
- Massachusetts
- Connecticut
- Rhode Island
- Maine
- New York
Useful references:
https://www.eia.gov/electricity/
https://www.nrel.gov/
https://www.dsireusa.org/
Want to find the annual solar savings in your county? Get my detailed financial analysis tool: SFS – U.S. Edition
Savings and Recommended Solar Size Based on Electricity Bill
A homeowner can save the amount s/he is paying to the grid by installing the right system size based on the monthly electricity bill. The below table shows the recommended system size and saving:
| Average Monthly Electricity Bill | Approx Monthly Electricity Usage* | Recommended Residential Solar System Size |
|---|---|---|
| $50/month | 250–350 kWh | 2–3 kW |
| $100/month | 500–700 kWh | 4–5 kW |
| $150/month | 750–1,000 kWh | 6–7 kW |
| $200/month | 1,000–1,300 kWh | 8–10 kW |
| $250/month | 1,250–1,600 kWh | 10–12 kW |
| $300/month | 1,500–2,000 kWh | 12–15 kW |
| $400/month | 2,000–2,600 kWh | 15–18 kW |
| $500/month | 2,500–3,300 kWh | 18–22 kW |
Example
A homeowner paying $200/month with electricity priced at 16¢/kWh is likely consuming roughly 200 ÷ 0.16 = 1,250 kWh/month and the annual consumption would be 1,250 x 12 = 15,000 kWh/year
Now, assuming each installed kW produces ~1,550 kWh/year in the USA. The required solar size becomes 15,000 ÷ 1,550 = 9.7 kW
So, the recommended system size would be roughly: 9–10 kW
Important Note
The actual required system size depends heavily on the number of factors, and one of these is the Peak Sun Hours. For example, a California homeowner may need a smaller system than a Washington homeowner for the same electricity bill because California receives more sunlight.
25-Year Savings Analysis from Solar in the USA
The following table estimates the approximate 25-year net savings for homeowners installing a 5 kW grid-tied rooftop solar system in each U.S. state.
Assumptions Used
System Cost
- Average installed cost before incentives: $15,000
- Federal tax credit (30%): -$4,500
- Net installed homeowner cost: $10,500
Maintenance & Replacement Costs Over 25 Years
Based on the maintenance schedule illustrated:
| Expense Item | Estimated Cost |
|---|---|
| Annual maintenance (~$175/year average over 25 years) | $4,375 |
| Inverter replacement (Year 10) | $900 |
| Inverter replacement (Year 18) | $900 |
| Structural repairs | $250 |
| Roof-related repair | $200 |
| Minor electrical repair | $75 |
| Total estimated lifetime maintenance & replacement cost | ~$6,700 |
Total Lifetime Ownership Cost of 5kW Solar
- Net installed system cost after incentives: $10,500
- Lifetime maintenance & replacement cost: ~$6,700
- Total estimated 25-year ownership cost: ~$17,200
Net Savings Formula
25-Year Net Savings = (Annual Savings × 25) − Total Ownership Cost
| State | Annual Savings ($/year) | Estimated 25-Year Gross Savings ($) | Estimated 25-Year Net Savings ($) |
|---|---|---|---|
| Alabama | 1,152 | 28,800 | 11,600 |
| Alaska | 1,352 | 33,800 | 16,600 |
| Arizona | 1,410 | 35,250 | 18,050 |
| Arkansas | 994 | 24,850 | 7,650 |
| California | 2,624 | 65,600 | 48,400 |
| Colorado | 1,290 | 32,250 | 15,050 |
| Connecticut | 1,836 | 45,900 | 28,700 |
| Delaware | 1,242 | 31,050 | 13,850 |
| Florida | 1,185 | 29,625 | 12,425 |
| Georgia | 1,064 | 26,600 | 9,400 |
| Hawaii | 3,480 | 87,000 | 69,800 |
| Idaho | 880 | 22,000 | 4,800 |
| Illinois | 1,139 | 28,475 | 11,275 |
| Indiana | 1,024 | 25,600 | 8,400 |
| Iowa | 1,035 | 25,875 | 8,675 |
| Kansas | 1,125 | 28,125 | 10,925 |
| Kentucky | 845 | 21,125 | 3,925 |
| Louisiana | 949 | 23,725 | 6,525 |
| Maine | 1,680 | 42,000 | 24,800 |
| Maryland | 1,206 | 30,150 | 12,950 |
| Massachusetts | 1,922 | 48,050 | 30,850 |
| Michigan | 1,140 | 28,500 | 11,300 |
| Minnesota | 976 | 24,400 | 7,200 |
| Mississippi | 980 | 24,500 | 7,300 |
| Missouri | 966 | 24,150 | 6,950 |
| Montana | 949 | 23,725 | 6,525 |
| Nebraska | 840 | 21,000 | 3,800 |
| Nevada | 1,513 | 37,825 | 20,625 |
| New Hampshire | 1,647 | 41,175 | 23,975 |
| New Jersey | 1,320 | 33,000 | 15,800 |
| New Mexico | 1,274 | 31,850 | 14,650 |
| New York | 1,612 | 40,300 | 23,100 |
| North Carolina | 994 | 24,850 | 7,650 |
| North Dakota | 792 | 19,800 | 2,600 |
| Ohio | 1,008 | 25,200 | 8,000 |
| Oklahoma | 1,014 | 25,350 | 8,150 |
| Oregon | 854 | 21,350 | 4,150 |
| Pennsylvania | 1,134 | 28,350 | 11,150 |
| Rhode Island | 1,953 | 48,825 | 31,625 |
| South Carolina | 1,095 | 27,375 | 10,175 |
| South Dakota | 884 | 22,100 | 4,900 |
| Tennessee | 952 | 23,800 | 6,600 |
| Texas | 1,312 | 32,800 | 15,600 |
| Utah | 1,020 | 25,500 | 8,300 |
| Vermont | 1,416 | 35,400 | 18,200 |
| Virginia | 1,035 | 25,875 | 8,675 |
| Washington | 684 | 17,100 | -100 |
| West Virginia | 854 | 21,350 | 4,150 |
| Wisconsin | 1,044 | 26,100 | 8,900 |
| Wyoming | 1,092 | 27,300 | 10,100 |
Key Observations
- States with very high electricity prices, such as Hawaii, California, Massachusetts, Rhode Island, and Connecticut, produce the strongest long-term residential solar savings.
- States with low electricity prices often have weaker financial returns despite receiving good sunlight.
- The economics improve substantially if electricity prices continue rising over time, which has not been included in these conservative calculations.
- The calculations also do not include additional state incentives, SRECs, utility rebates, or battery arbitrage opportunities, which can significantly improve real-world savings.
- In reality, many homeowners in high-electricity-price states can exceed these projected savings due to annual utility rate escalation.
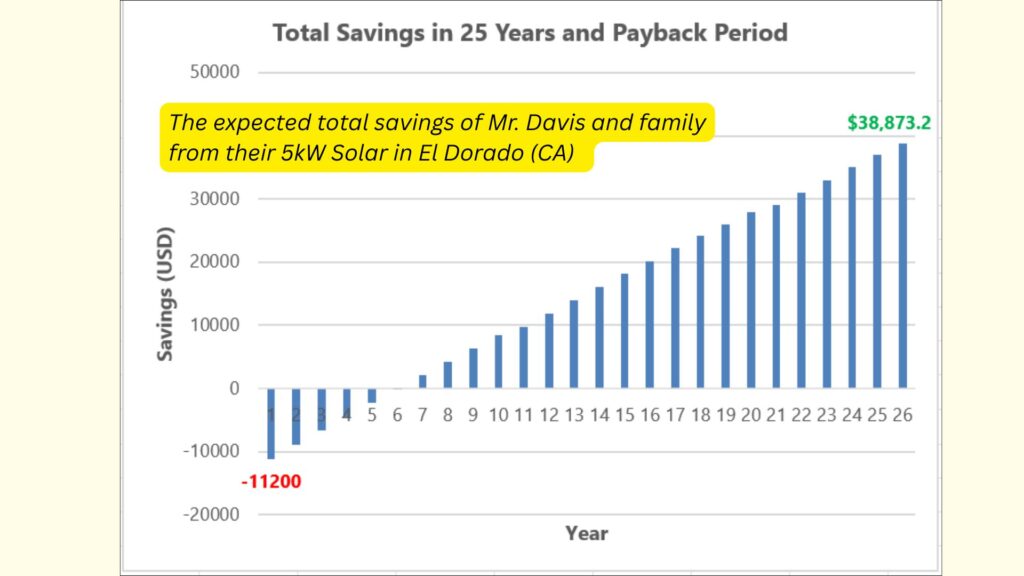
Real Case of 5kW Solar in El Dorado, California
Mr. Davis and his family live in El Dorado and are planning to install solar to meet their energy needs. Their average monthly consumption is 715 kWh, making it an average of 24 units per day. Also, the family consumes most of the electricity in the daytime, which further makes solar even more attractive without considering the export compensation rates in the county.
They were recommended a 5kW solar system with the following details:
- Expected Cost: $16,000
- Incentive: $4,800
- Net expected cost: $11,200
- Recommended Technology: TOPCon Solar Panels (Lower degradation, high efficiency and better performance under high temperatures)
- Inverter: 4.6 kW (Enphase or Fronius)
- Optimal Tilt and Orientation: 33° and facing towards South
Financial Feasibility:
The system is expected to save over $38,000 in 25 years, with a payback period of approximately 6 years.
Since installation, in 6 months, Mr. Davis and family have saved over $1100, and the family is very happy with the solar performance.
Mr. Davis says, “I feel solar is one of my best investments in life. We are not only saving every day but also enjoying smooth electricity every moment. I recommend that everyone in El Dorado go solar (based on their energy needs) and save money, get energy independence, and contribute to preserving the environment.”
Common Mistakes Homeowners Make While Going Solar — And How to Avoid Them
Installing a residential solar system can significantly reduce electricity bills and generate long-term savings, but many homeowners make unrealistic assumptions while planning their solar investment. They also make some common mistakes which can reduce the expected financial returns and extend the actual payback period by several years.
Understanding these common errors beforehand can help homeowners design a more financially optimized and future-ready solar system.
Assuming Solar Automatically Guarantees Fast Payback
One of the most common misconceptions is that once a solar system is installed, the payback period becomes automatic — for example, assuming the system will recover its cost in 4–5 years regardless of usage behavior. In reality, solar savings depend not only on the system size and sunlight availability but also on the homeowner’s electricity consumption habits.
The amount of solar electricity directly consumed during the daytime plays a major role in determining actual savings. Homeowners who maximize daytime self-consumption usually achieve faster payback periods than those who export a large portion of their solar generation back to the grid.
Oversizing the Solar Only for Grid Export
Another major mistake homeowners make is intentionally installing a solar system much larger than their actual energy needs under the assumption that excess electricity exported to the grid will generate substantial additional income.
While this assumption may have worked in some older net-metering programs, the reality today is different in many states. Utilities often compensate exported solar electricity at a much lower rate than the price at which they sell electricity to homeowners.
For example:
- A homeowner may purchase electricity from the grid at:
- 30–40 cents/kWh,
- but receive only 3–8 cents/kWh for exported solar electricity under certain net billing structures.
This means exporting large amounts of excess electricity may not provide the financial returns many homeowners expect.
Therefore, in most cases, homeowners should size their solar system primarily around their realistic electricity consumption needs and aim to maximize self-consumption while minimizing unnecessary exports to the grid.
Ignoring Future Energy Requirements
However, there is an important distinction between unnecessary oversizing and strategic future planning.
Many homeowners make the opposite mistake by designing a solar system only for their current electricity usage while ignoring future increases in energy demand. In such cases, a slightly larger system can actually be a smart long-term decision.
Future energy needs may increase due to:
- purchasing an electric vehicle (EV),
- future home EV charging,
- adding new family members,
- children moving back home,
- retirement and increased time spent at home,
- work-from-home arrangements,
- installing electric heating or heat pumps,
- or expanding the home in the future.
In these situations, moderately oversizing the system based on realistic future consumption growth can help homeowners avoid costly future upgrades or additional installations.
A well-designed residential solar system should balance:
- present energy needs,
- future electricity demand,
- self-consumption optimization,
- utility compensation policies,
- and long-term financial returns.
To size the complete solar power system and estimate realistic solar savings for your own home using location-based assumptions and long-term financial modeling, you can use the Solar Financial Feasibility Tool: SFS – U.S. Edition.
Conclusion
Yes, solar is financially attractive in the USA, and over its lifetime, it can save you a substantial amount of money.
However, the actual savings achieved by a homeowner depend on several important factors that we discussed throughout this guide.
One of the most important factors is how much of the solar electricity the homeowner directly consumes during the daytime. In many utility territories, exported solar electricity is compensated at a lower rate than the retail electricity price. Therefore, homeowners who maximize self-consumption instead of exporting large amounts of electricity to the grid usually achieve higher annual savings and faster payback periods.
At the same time, homeowners should also plan intelligently for future electricity needs. Installing a slightly larger system may make sense if future consumption is expected to increase due to:
- electric vehicle charging,
- work-from-home arrangements,
- family expansion,
- or retirement-related lifestyle changes.
While rooftop solar is a highly attractive long-term investment, it is not completely maintenance-free. Including realistic maintenance expenses, inverter replacement costs, and system degradation in the financial analysis provides a much more accurate estimate of actual savings and payback periods.
In many cases, rooftop solar itself is not the problem — unrealistic financial expectations are. When homeowners understand the technical and financial realities properly, residential solar remains one of the most effective energy investments to reduce electricity bills, increase energy independence, and generate long-term savings in the United States.
FAQ
1) How much money can a homeowner save in the USA using solar?
A typical homeowner in the USA can save an average of $1,236 annually from a standard 5 kW residential solar system. However, the actual savings depend on the location’s Peak Sun Hours, the grid price, the solar panel technology, the self-consumption pattern, and the homeowner’s maintenance behaviour.
2) What is Net-Metering?
Net-metering is an arrangement that allows bidirectional flow of electricity from the grid to the house and from solar panels to the grid (when excess electricity is generated). And the homeowner is compensated for those extra solar units.
3) 3) How can a homeowner in the USA get the maximum benefit of solar?
A homeowner should size the system in a way that s/he can self-consume the maximum percentage of the solar electricity.
4) What should a homeowner do if s/he is expecting an increase in energy needs in the future?
The Homeowner should go for a slightly oversized solar power system to meet the future energy demands.