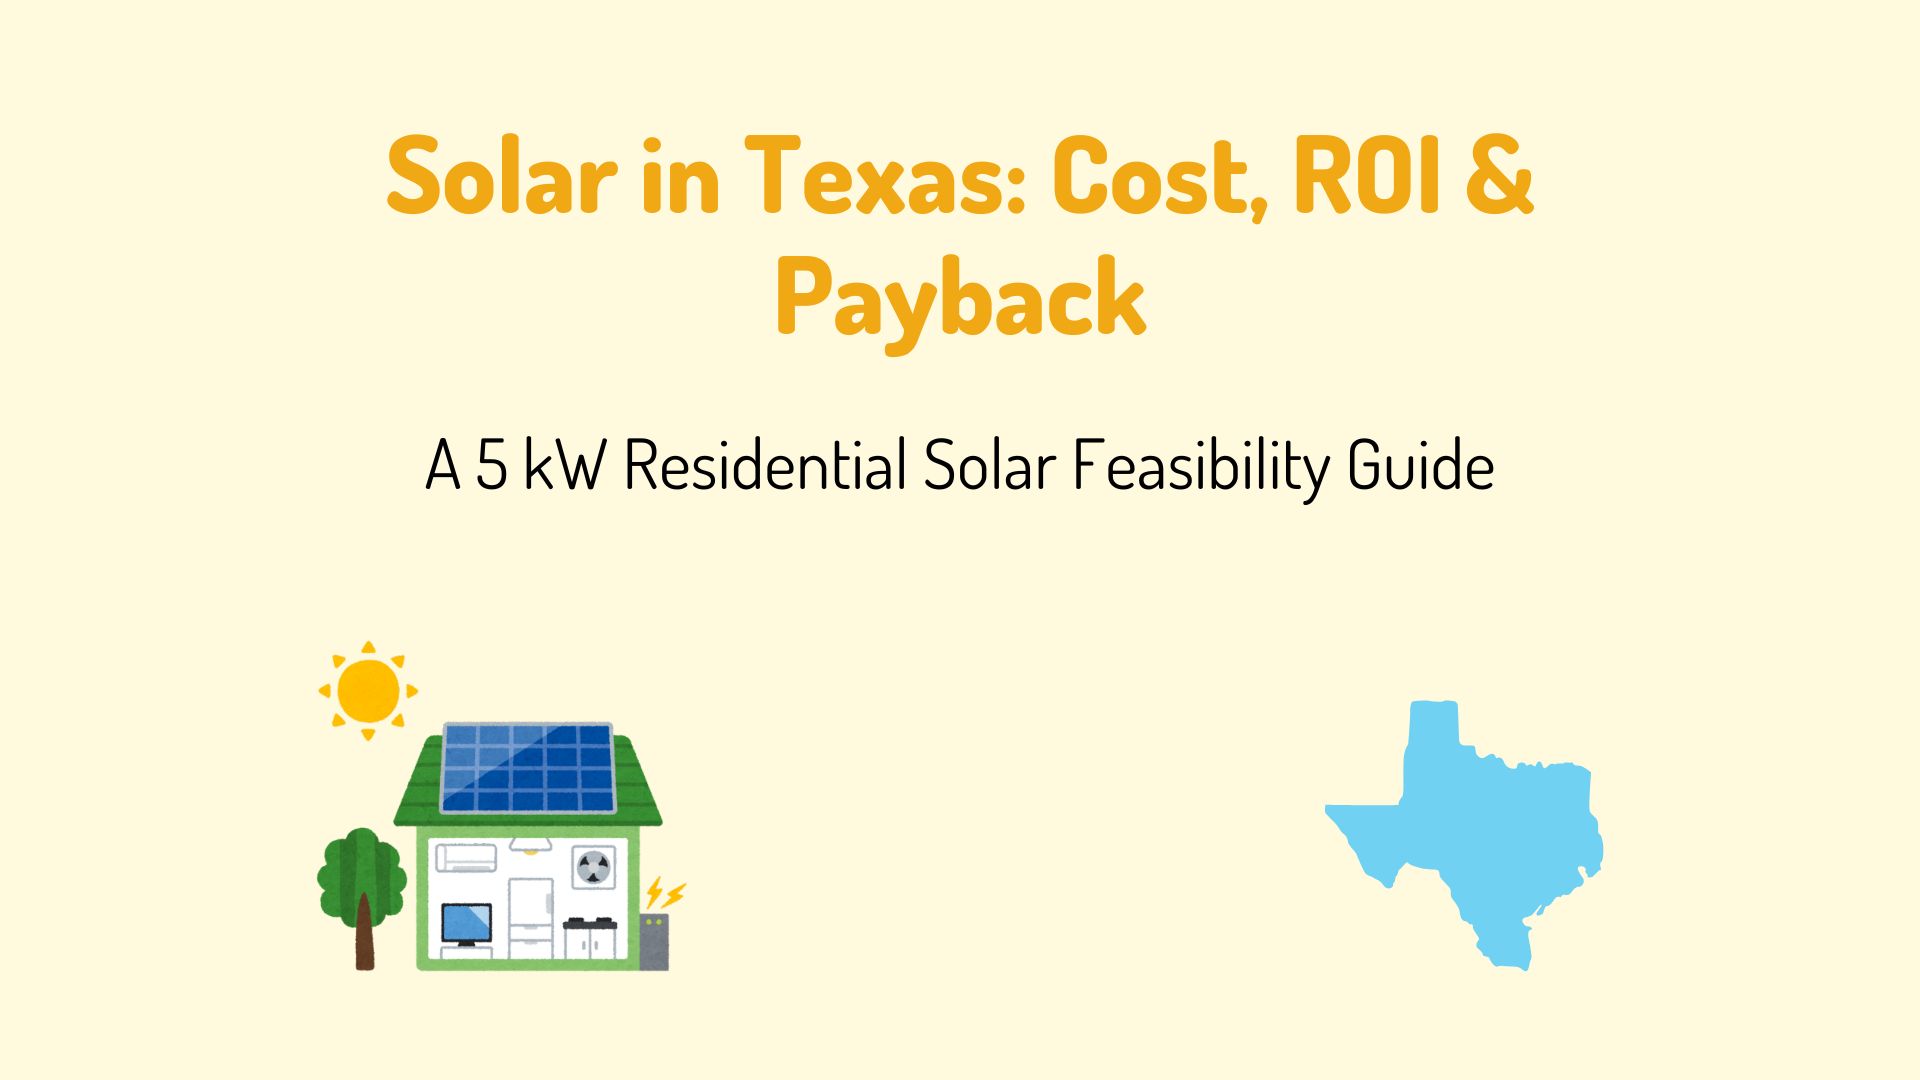
Solar in Texas: Cost, ROI, Payback & Is It Worth It? – Complete Guide
Is installing solar panels in Texas financially worthwhile?
In this detailed guide, I analyze solar system cost, electricity generation, grid prices, ROI, and payback for a 5 kW residential rooftop solar system across different regions of Texas.

Texas has abundant sunlight and diverse climatic conditions, making it technically well-suited for solar — but financial feasibility depends largely on system cost and local electricity price escalation.
Solar Feasibility in Texas: Quick Answer
To determine whether solar is financially worth it in Texas, we must evaluate both technical feasibility and economic returns. This includes analyzing sunlight availability (Peak Sun Hours), climate conditions, electricity generation, system cost, grid electricity prices, and their long-term escalation.
Texas spans a wide latitude range, resulting in significant variation in sunlight and climate across the state — directly influencing solar system performance and financial returns.
Want to check whether solar is financially worth it for your exact location and electricity usage in Texas?
Use the Solar Feasibility Spreadsheet (US Edition) to size your system, estimate annual generation, and calculate ROI and payback in minutes.
Solar Sunlight Potential in Texas (Peak Sun Hours)
The very first step of designing the system is to know the Peak Sun Hours in that region.
By Peak sun Hours, I mean to say that amount of sunlight falling on the surface. Good Sunlight is favorable for solar design and its profitability. You can see that the Average Peak Sun Hours in the State are 5.65. Any value above 5 is considered very good.
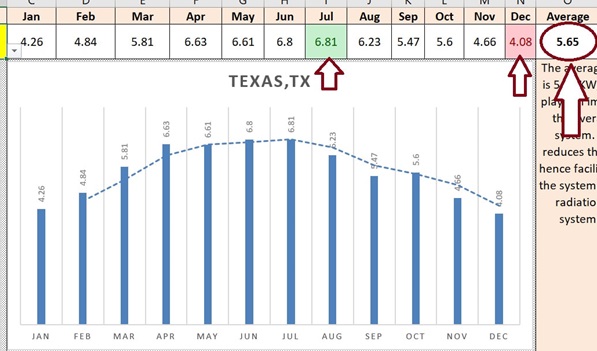
I can say that Texas receives a good amount of Sunlight which makes Solar a favorable energy option for its residents and homeowners. Texas is a big state with its area spanning around 6,95,662 km² with many geographical diversities where you can see hot, warm, humid, and cold climates.
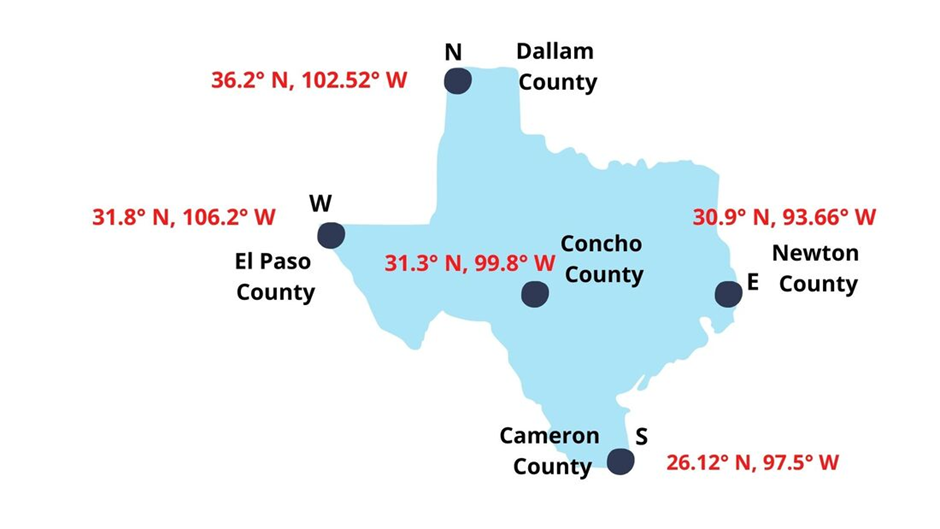
And due to this, you can feel the difference in the Sunlight from East to West and North to South of the state. In order to get the real picture of the Sunlight intensity across the state, let me take 4-5 counties in each direction: East, West, North, South, and the Center.
The Peak Sun Hours in 5 counties of Texas
Let’s check out the Peak Sun Hours in these counties of the state.
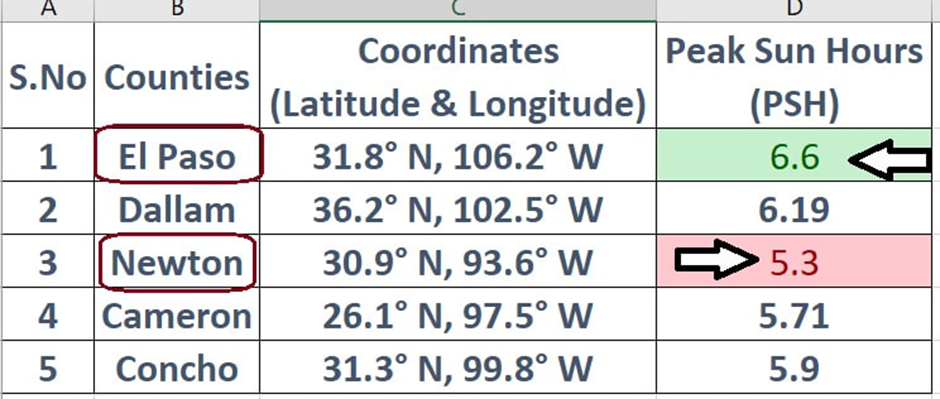
You can check out from the above table that El Paso (The Western-most County) receives the highest PSH amongst the above 5 counties
Whereas Newton County (The Easternmost part of the state) has the lowest PSH. Therefore, people living in El Paso have the advantage of a very good amount of Sunlight when compared to the other 4 counties of the state.
“With the same energy needs, a person living in El Paso needs the least number of Solar Panels to meet her/his energy demands.”
Climate & Weather Impact on Solar Panels in Texas
Understanding the climate of Texas will help us in choosing the right Solar Panel for designing the system. Tornadoes are more frequent in Texas than in any other state in the United States.
(*Tornado is a violently rotating air column that extends from thunderstorm to the ground).

Let us divide the state into 5 geographical regions and then study the climate:
(i) North
(ii) South
(iii) East
(iv) West
(v) Central
The North of Texas
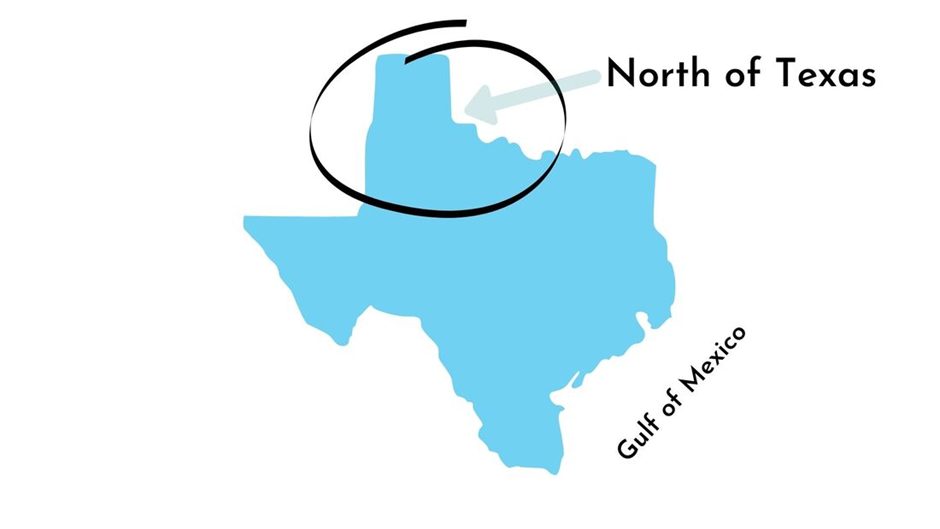
The Northern region of the state lies in the Tornado alley (It is the region around the central part of the USA where Tornadoes are more frequent, and North of Texas lies in that region). This region is a semi-arid (dry climate) that receives little rainfall.
The sky is mostly clear in the summer season. The average annual daily temperature in Dallam County is 21.4 °C.
(Day Temperature: Average temperature when there is Sun in the sky)
On the map, you can see that the Northern part is quite far from the Gulf of Mexico. Therefore,
in winter, you can see the temperature falling below the freezing point at night. The winters are short in the region.
As discussed, the northern part of the state is in Tornado Alley. So, a person living in the northern part of the state who is interested in going solar then s/he must look for panels that can withstand heavy wind pressure during an event of Tornado.
Let me show you the chart of wind speed and its corresponding pressure:
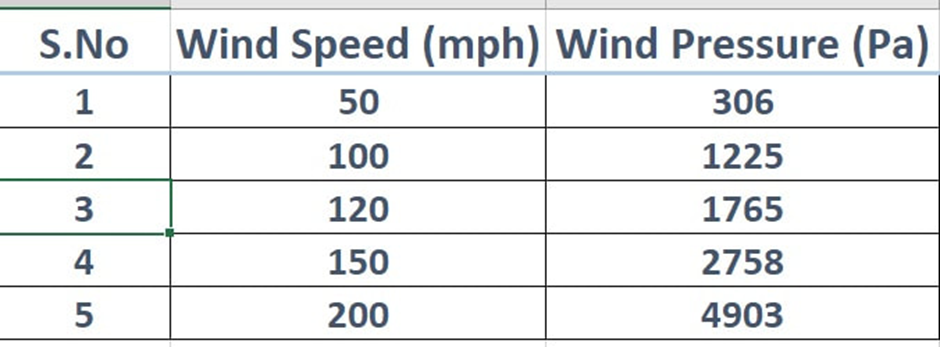
Although the average wind speed is in the range of 12-13 mph, there were instances in the past where the recorded wind speed was more than 80 mph. Therefore, one should look for a solar panel that is capable of withstanding high wind speeds.
The industry average is 2400 Pa (Look for the Rear Load of the panel specifications). So, get a panel that is stronger than the industry average.
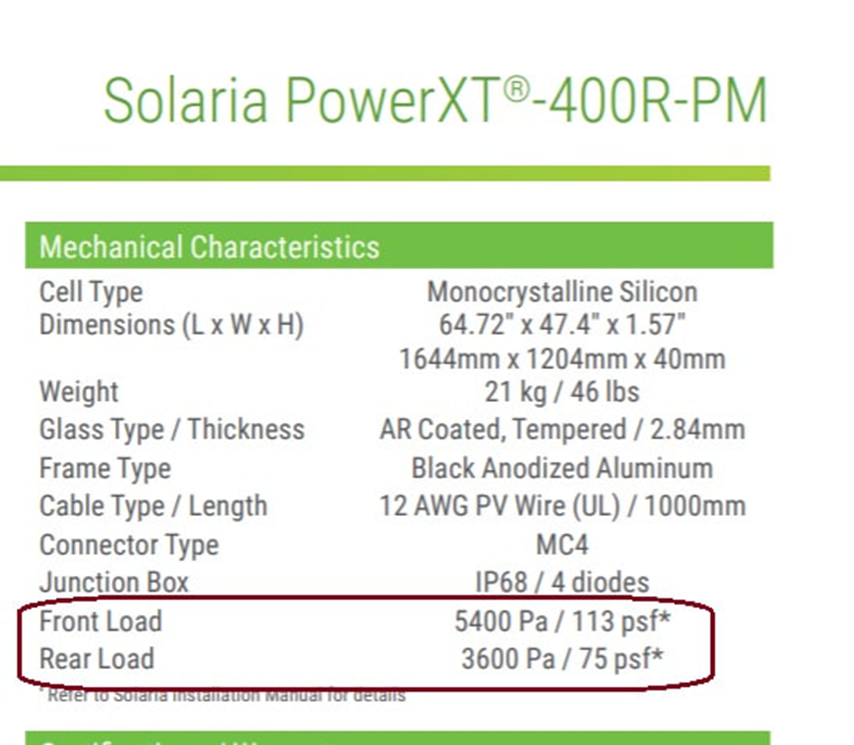
Kindly look at the part of the datasheet of Solaria Power Solar Panel. You can see that its Rear Load strength is 3600 Pa (very well above the industry average).
The western region of Texas
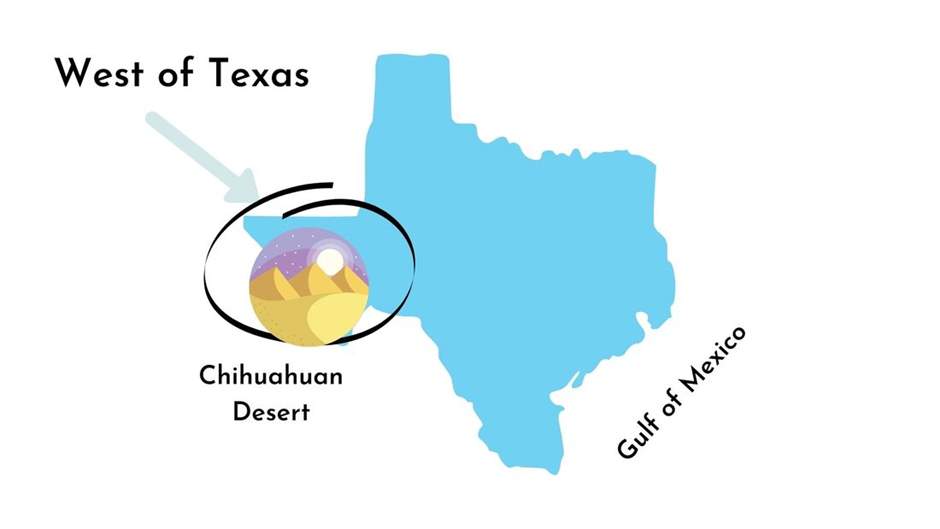
This Western region of the state is mostly arid and receives annual rainfall below 16 inches. This region consists of the Chihuahuan Desert and mountain ranges. It is the region that receives the maximum amount of sunlight, and the average annual daily temperature in El Paso County is 16.4 °C
You can check in the Excel table above that El Paso county that comes in the western region of the state, receives the maximum sunlight (6.6 PSH) amongst the 5 that are mentioned in the table.
You need fewer panels to meet your energy needs if you happen to use solar energy in that part of the state. This region does experience winds; therefore, high-strength solar panels are preferred.
Central region of Texas
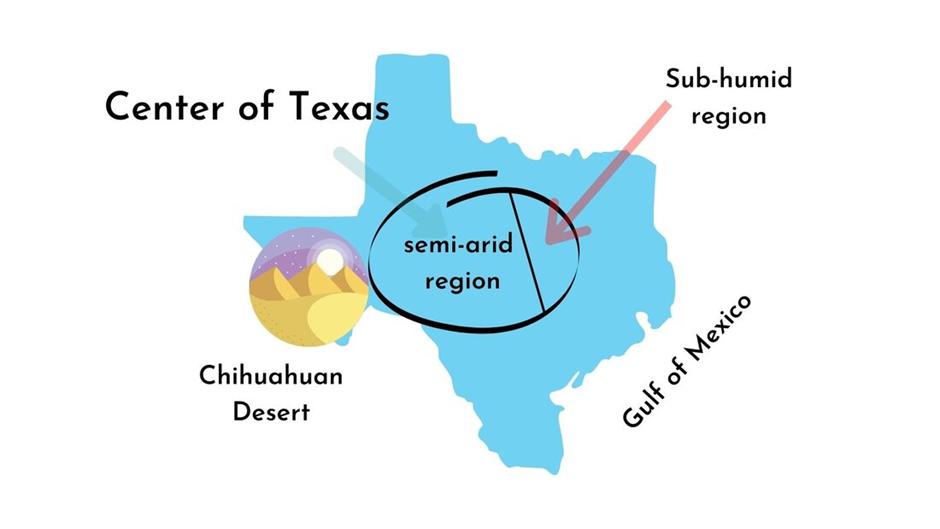
The center region of Texas is a mix of semi-arid and sub-humid climates. The Western and Central western part of the Central region of Texas is semi-arid, while the Eastern and Southern parts have sub-humid climates. It is due to its proximity to the Gulf of Mexico.
The humidity is high in this part. And because of this (water droplets hinder sunlight reaching the surface of the earth), the average sunlight intensity is lower than in the Western and Northern regions of the state.
Please check out the Peak Sun Hours (PSH) of Concho County (which lies in central Texas); they are 5.9, which is less than the PSH of El Paso County (East) and Dallam County (North).
The average annual daily temperature in Concho County is around 26 °C.
“With same energy needs, a person living in Concho County will need more number of Solar Panels that of a person living either in El Paso County or Dallam County”
The eastern region of Texas
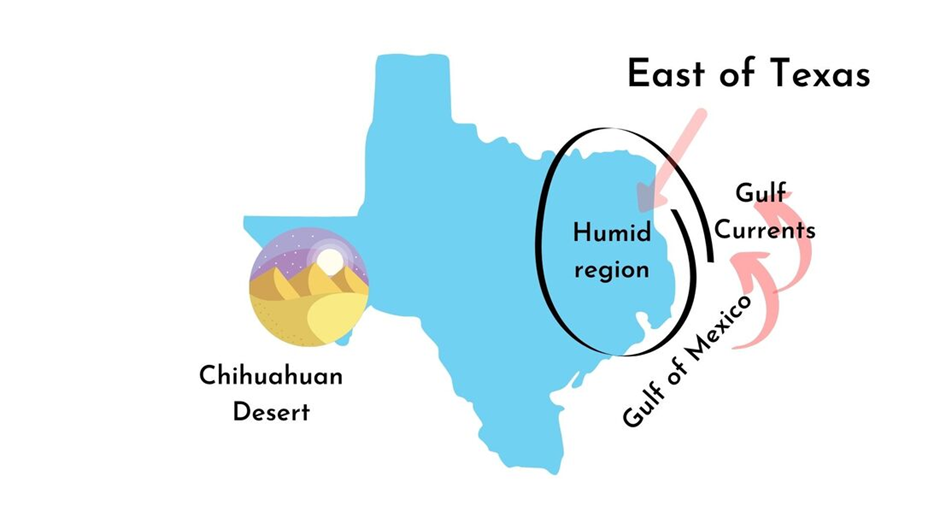
The East of Texas lies in the humid zone that receives a good amount of rainfall. It is all because of its proximity to the Gulf of Mexico that brings currents over this region and finally precipitates as rainfall.
You’ll see mostly cloudy days over the eastern coastline, while in the western part of this eastern region, the days are clear in summers. This is also the region where one can see hurricanes and cyclones.
Things to consider from a solar point of view:
1) Due to humidity, the Peak Sun Hours are affected (Newton County: 5.3 PSH)
2) We need stronger panels that can withstand high wind speeds.
3) The average annual daily temperature in Newton County is 23 °C
The southern region of Texas
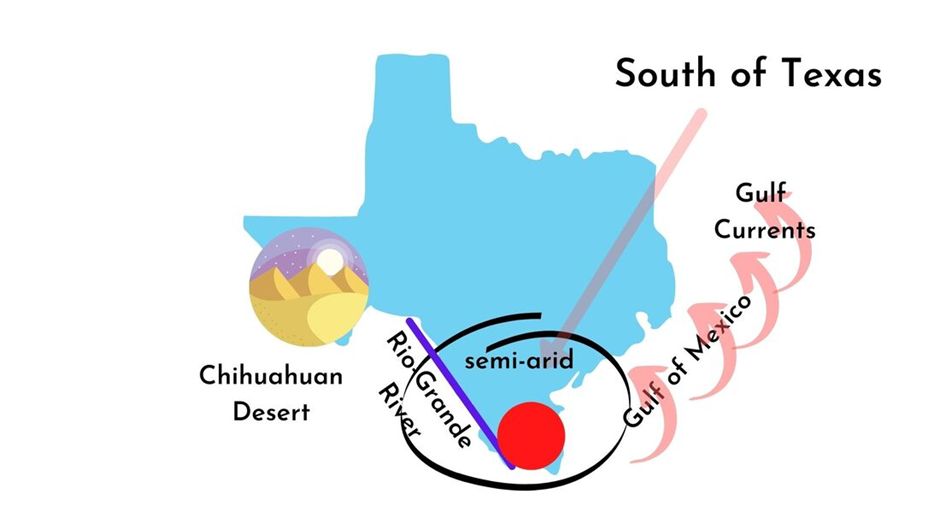
The coastal areas of the Southern part of the state are humid due to the nearby Gulf of Mexico and the Rio Grande River. While the inland region is semi-arid in nature.
The coastal area near to the Gulf of Mexico has a tropical weather system and is a target of hurricanes and cyclones.
Main points from Solar’s point of view:
- The coastal area is humid and the Peak Sun Hours of Cameron (The Southern tip of the state) is 5.71
- Look for panels of high rear strength to withstand wind pressure.
- The average annual day temperature in Cameron County is 29 °C
How Much Electricity Does a 5 kW Solar System Produce in Texas?
Factors
The electricity produced by the solar power system depends on many environmental factors like sunlight intensity, temperature, humidity, etc.
while sunlight intensity has a direct relation with the units produced by the system. But the factors like temperature, humidity, etc have an inverse relation with solar electricity produced by the system.
That is, with an increase in temperature and the increase in moisture content in the atmosphere, the output of your solar power system is going to reduce.
An example of solar in Texas
Let’s take solar-electricity units produced by the 5 kW systems when each of them is placed in the above 5 counties (El Paso, Dallam, Newton, Cameron, and Concho).
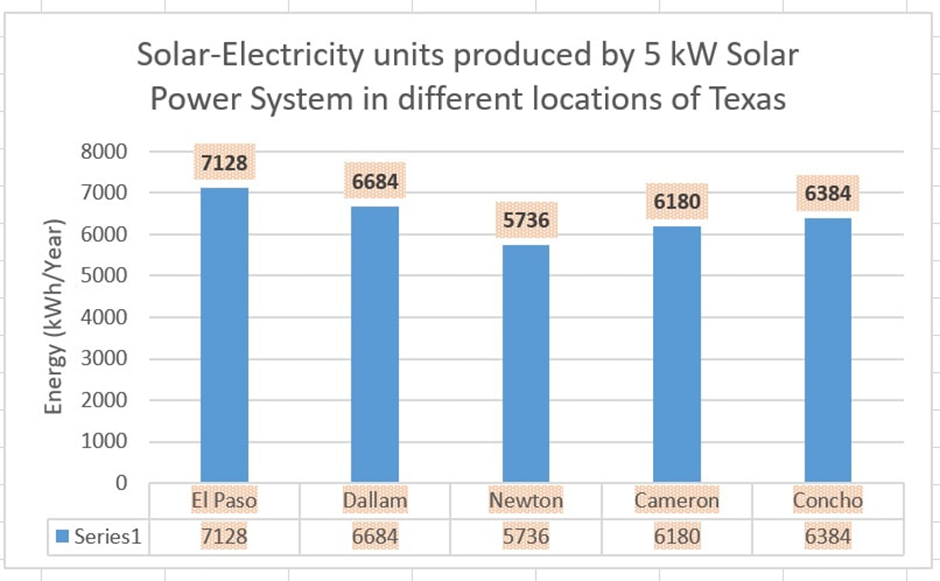
You can see in the chart above that the 5 kW solar power system in El Paso County produces the maximum units of 7128 per year amongst the 5 locations of Texas.
And the same 5 kW solar power in Newton County of the state produces the least, that are 5736 units per year.
The average of units produced in all 5 locations is 6422 units per year.
To make the electricity generation figures easier to interpret, the chart below shows the average annual energy output of a 5 kW solar system in Texas using a normal distribution.
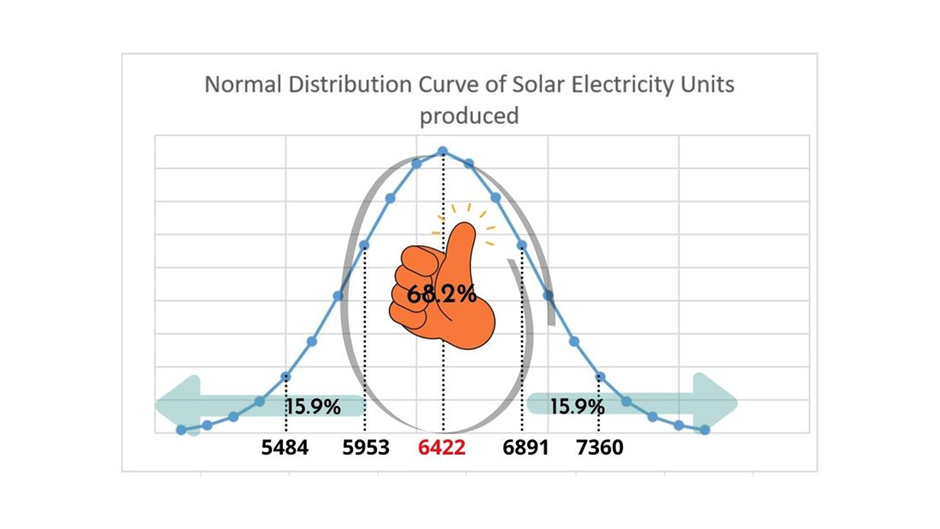
Let’s understand this…
If you’re having a 5 kW system in Texas, then:
- There are 68.2% chances that it is going to generate in between 5953 to 6891 solar electricity units per year.
- 15.9% chances for more than > 6891 units per year
- And 15.9% chances for less than < 5953 units per year.
Cost of a 5 kW Solar Power System in Texas
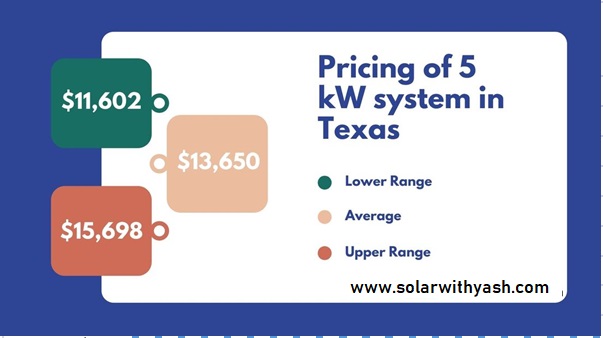
The average cost of a 5 kW solar power system in Texas is around $13,650 before the Investment Tax Credit (ITC), which comes to roughly $2.73 per watt. Some homeowners end up paying more than this amount, while others manage to get the system installed at a lower cost than the market average.
When you clearly understand the sizing and design of each component in a solar power system, you can avoid unnecessary oversizing and extras. This knowledge alone can help you save a few thousand dollars compared to the average prices prevailing in the solar market.
I’m going to take this average cost as the first step towards finding the financial feasibility of a 5 kW Solar Power System.
Texas Electricity Rates & Escalation
The grid price and its escalation tell us about the economic value that you’re going to save in the future when you switch to Solar. If either the grid price or its escalation, or both, are above the country average, then switching to solar would give you more economical value.
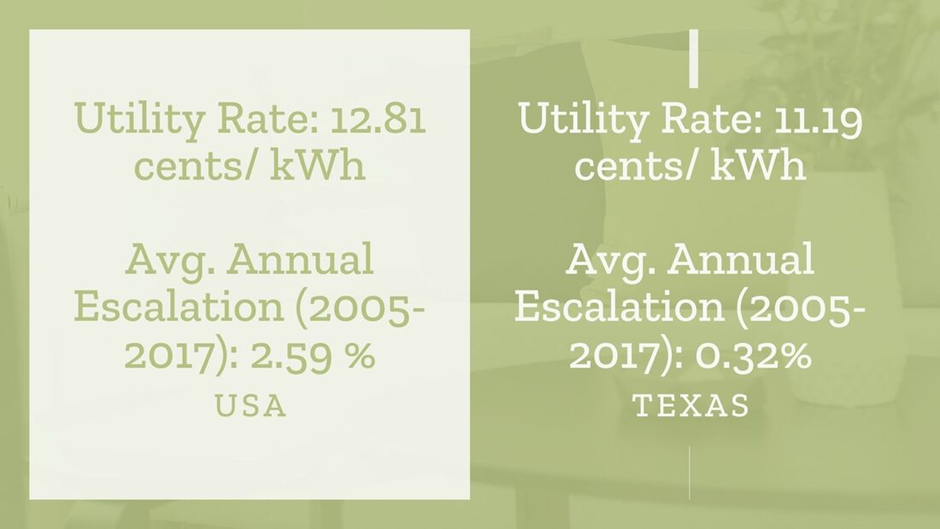
The 12-month average residential grid electricity rate in the US is 12.81 cents/ kWh, and its 12-year (2005-2017) growth rate is 2.59%.
On the other hand, the grid electricity rate in Texas is 11.19 cents/ kWh, and its 12 year escalation during the same period is 0.32%.
If I plot a graph of Electricity rates in the next 25 years taking 0.32% as the escalation.
Then my graph will look something like this:
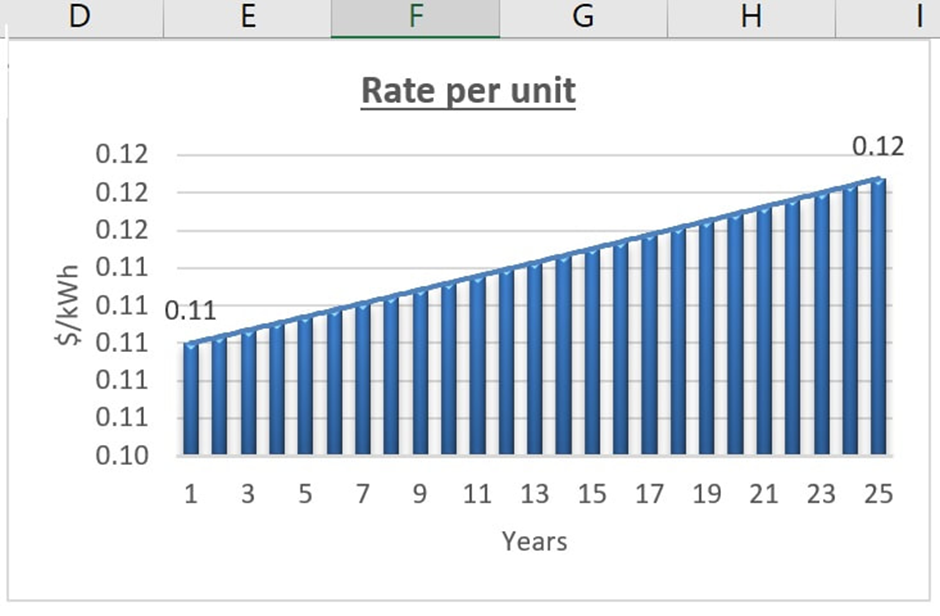
It means that if I’m paying 11 cents today for consuming 1 unit today, I would be paying 12 cents for the same unit consumed in the 25th year.
In other words, if you switch to solar today, then it is going to save you 12 cents per solar unit that will be generated in the 25th year.
Solar ROI and Payback in Texas (With ITC)
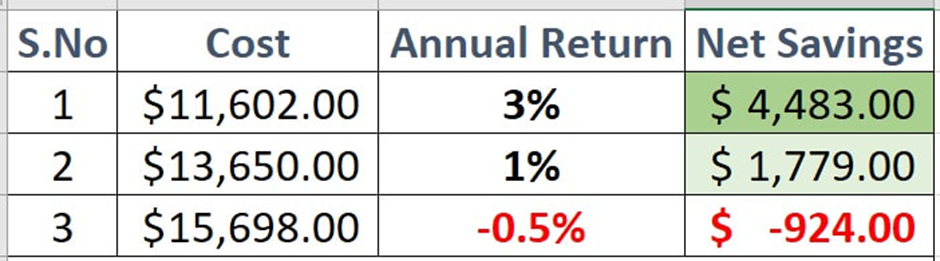
Let us now look at the annual returns and total net savings over 25 years for a 5 kW solar power system under different system cost scenarios.
Case 1: When you purchase the system at its average cost of $ 13,650 prevailing in the market then the annual return offered would be 1% and Net Savings would be $ 1,779.
The Case 2: When the cost is $ 11,602 (Lower Range) with a return of 3% and net savings: $ 4,483
Case 3:
(i) Cost: $ 15,698
(ii) Return: -0.5%
(iii) Net Savings: Negative
Return after ITC
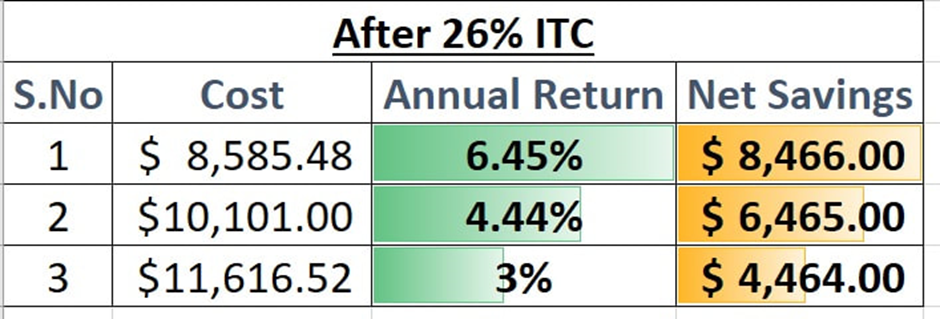
Okay, now let us analyze the returns under different system costs after applying the 26% Investment Tax Credit (ITC).
For example, if you purchase a 5 kW solar power system at the average cost of $13,650, then after availing the 26% ITC, the net cost borne by you would be:
= $13,650 − (26% of $13,650)
= $13,650 − $3,549
= $10,101
Similarly, a system purchased at $11,602 would cost $8,585 after ITC, while a system priced at $15,698 would come down to $11,616 after ITC.
The annual returns and net savings for these three cost scenarios after ITC are summarized in the table below.
Now, the question that strikes in anyone’s mind is, “Why is the return low?”
Although everything is good about the state, like:
A very good amount of sunlight
ii) Right Temperature
iii) The units produced by the 5 kW system are very good
iii) 26% ITC
Let me answer this,
Did you notice one thing about the electricity price and its escalation in the state?
The grid price in Texas (11.19 cents/kWh) is less than the country (US) average of 12.81 cents/kWh. However, this difference is not wide.
But when you compare the escalation in grid prices of Texas (0.32%) with that of the country (2.59%). You’ll notice that it is very low when compared with the country’s average.
It is because of the very low grid escalation rate in the state that the economic benefits of switching to Solar are less when compared to other US states, where grid prices and escalation are higher than the country’s average.
But that doesn’t mean Solar is not Feasible. It is very smooth and easy in terms of designing and financially profitable despite the low grid escalation in the state.
Final Verdict: Should You Go Solar in Texas?
Texas is a Sunlight rich state where Solar Power Installation is favorable. Let us summarize the feasibility of Solar Power System in 2 parts:
(i) Technical design
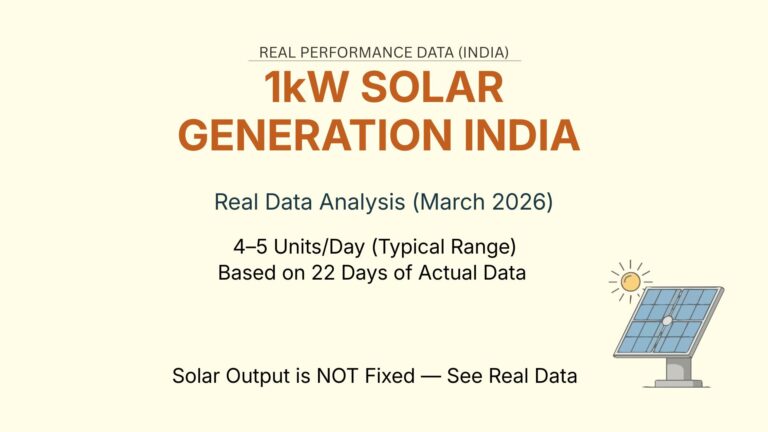
Texas receives a good amount of sunlight throughout the year, and a 5 kW residential solar power system is capable of producing, on average, around 20 units of electricity per day.
However, Texas is also a state where tornadoes and cyclones are relatively common, especially in certain regions. Because of this, homeowners should pay close attention to the mechanical strength of solar panels.
The industry average rear load rating for solar panels is 2400 Pa, but in Texas, it is advisable to select panels with a rear load strength greater than 2400 Pa to ensure long-term reliability during high-wind events.
If you are planning to include battery backup in your system, it is recommended to use an MPPT solar charge controller between the solar panels and the battery bank. This is because solar panels operating below 25°C tend to produce higher voltage than their rated value under Standard Test Conditions.
This voltage difference between the panels and the batteries is efficiently handled by MPPT charge controllers, which convert the excess voltage into additional current. In simple terms, MPPT controllers ensure that maximum power is always extracted from the solar panels, improving overall system performance and financial feasibility.
Texas lies in the Northern Hemisphere, with latitude ranging from 25°50′ N to 36°30′ N. Based on these latitude values, solar panels should be installed facing south, with an optimal tilt angle ranging between 21.7° and 30.8°.
Following this orientation and tilt ensures maximum annual energy generation from the system.
Overall, the technical sizing and design of a solar power system in Texas are strong and well-suited to deliver reliable electricity for decades.
(ii) Financial feasibility of solar in Texas
The profitability and return offered by the solar power system depend mainly on i) Sunlight ii) the cost of the system and its maintenance cost and iii) the grid prices and its escalation rate.
2) Based on the above factors, the return provided by the 5 kW solar power system can be depicted as follows:
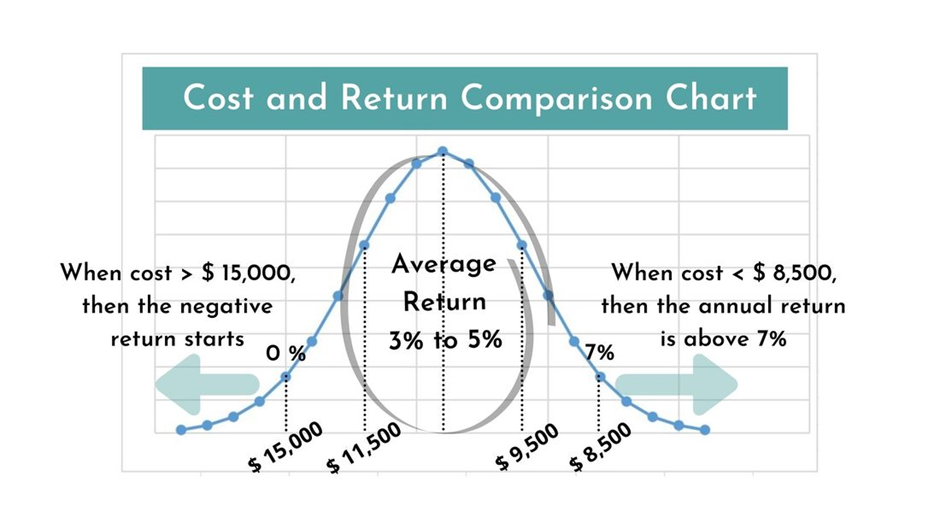
Let us understand this:
- When the cost of 5 kW solar power system is in between $ 11,500 and $ 9,500, the annual return is in the range of 3% – 5%
- When the cost of the same system goes beyond $ 15,000, the annual return becomes negative.
It is not financially profitable.
- When the cost of the 5 kw solar power system is less than < $ 8,500, the annual return is more than 7%.
Your focus area should be to get the system around $ 8,500. This is thinkable and likely when you know your energy needs, sizing, and designing of each component.
You can easily negotiate with your solar installer and can always put your point that you are saving his time on activities like knowing energy needs, sizing, and designing activities.
And you can always ask him to compensate for his time saving with an equivalent amount of monetary discount.
Moreover, your knowledge about the system empowers you to get the solar parts and their components at the most competitive prices available in the market. This was all about Design, Cost, and the Profitability of the 5 kW Solar Power System in Texas.
Based on the above technical and financial analysis, going solar in Texas makes sense when the system is properly sized and priced. I welcome you to share your thoughts, questions, or experiences regarding the design and profitability of solar power systems in the comments section below.