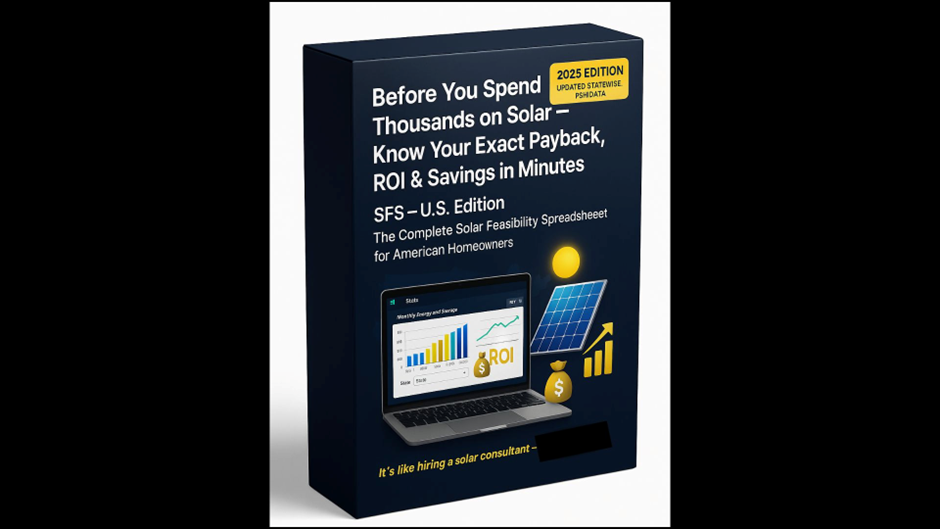
Before You Spend Thousands on Solar — Know Your Right System size, Exact Payback, ROI, NPV, IRR & Lifetime Savings in Minutes.
The Solar Feasibility Spreadsheet U.S. Edition is built to give homeowners accurate, county-level solar payback, ROI, and feasibility results using real data — not assumptions.
💭 Solar Sounds Great… But Most Homeowners Aren’t Sure If It’s Worth It
Solar is one of the most powerful ways to reduce energy bills in the United States — especially today.
But even with all the excitement, homeowners still ask the same questions:
- “Will solar actually save me money?”
- “What will be my payback period?”
- “Is solar really worth it in my county?”
- “What size system do I even need?”
- “Are installer ROI claims accurate?”
People love the idea of solar,
…but they fear the uncertainty behind the investment.
And that hesitation is completely valid.
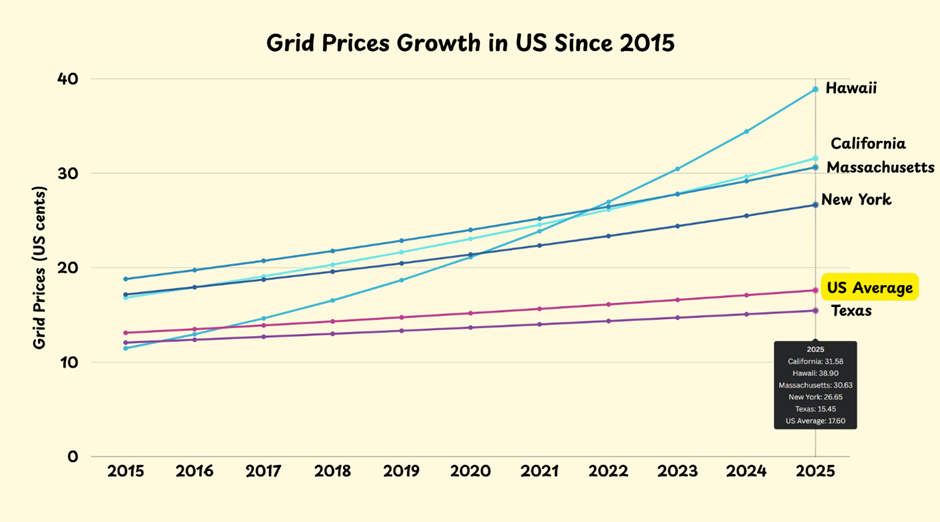
⚡ Electricity Rates Are Rising — Making Solar More Attractive (and More Confusing)
Across the U.S., utility rates have increased year after year due to:
- changing fuel costs
- infrastructure upgrades
- grid instability
- extreme weather risks
- regional shortages
States like California, New York, Massachusetts, Hawaii, and even Texas have experienced significant increases.
This makes solar extremely appealing.
But it also raises new doubts:
“If grid prices are rising… shouldn’t solar be even better?
But how much better — for my exact home?”
That is the question homeowners want answered with real numbers — not marketing slogans.
⚠️ The Real Problem: Many Solar Feasibility Tools and Installer Quotes Aren’t Accurate
Most solar feasibility tools online rely on:
- state-level averages
- generic assumptions
- annual sunlight without monthly variation
- unrealistic savings
- inflated payback estimates
But every home and every county is different.
A 5kW system in:
- Maricopa County, AZ
- King County, WA
- Cook County, IL
- Orange County, CA
- Harris County, TX
…will produce very different monthly and annual results.
Yet 99% of solar feasibility tools don’t account for this.
So, homeowners end up making guesses, not informed decisions.
Unlike generic online calculators, the Solar Feasibility Spreadsheet U.S. Edition uses county-specific PSH and 12-month billing data to produce engineering-grade accuracy.
💡 That’s Why I Created the Solar Feasibility Spreadsheet (SFS – U.S. Edition)
After years of helping people understand solar payback and ROI across different geographies, one truth became obvious:
Homeowners don’t hesitate because solar is complicated.
They hesitate because the numbers aren’t transparent.
People want:
- clarity
- accuracy
- realistic savings
- county-level sunlight
- real generation
- real payback
- real ROI
- and no sales pressure
So, I built a tool that finally gives all of this.
⚙️ Meet the Solar Feasibility Spreadsheet (SFS – U.S. Edition)
The Solar Feasibility Spreadsheet (SFS) — U.S. Edition is your personal solar consultant inside Excel.
The SFS is the only homeowner-friendly spreadsheet that uses:
- data from all 3,100+ U.S. counties
- 12-month county-specific PSH (Peak Sun Hours)
- your 12-month energy bill
- real system loss modeling
- accurate financial calculations
…to give you a complete solar feasibility study for your home. Everything you wish installers told you — in one place.

SFS is more than a solar feasibility tool — it calculates true payback, ROI, and savings using engineering logic.
📊 What SFS Helps You Discover in Just 5 Minutes
Just enter:
- State
- County
- Monthly electricity bill
- Cost of the system or installer quote
- Grid Rate
And instantly get:
- ✓ Ideal solar system size (kW), Orientation, and Tilt
- ✓ Monthly and annual solar generation (based on your county)
- ✓ True payback period
- ✓ ROI (20–25 years), NPV, and IRR
- ✓ Yearly bill savings
- ✓ System losses included
- ✓ Monthly grid import/export
- ✓ Solar vs Grid cost per kWh
- ✓ Future cash flows, discounted
- ✓ Verdict: Is solar feasible in your county — yes or no?
This isn’t guesswork — it’s engineering + financial modeling simplified.
🔧 SFS Goes Beyond System Size — It Does Real Engineering
Most calculators stop at panel sizing.
SFS includes full technical engineering logic:
- ✓ Inverter size based on DC system & county temperature
- ✓ DC/AC ratio optimization
- ✓ Wire gauge recommendation
- ✓ Solar panel count & roof area needed
- ✓ Optimal tilt angle (latitude-based)
- ✓ Best orientation for your county
- ✓ Realistic derating based on losses
You’re not just getting “how many panels” —
you’re getting a technical blueprint for your system.
🌤 12-Month PSH for Your Exact County — Ultra-Accurate Sunlight Modeling
Most tools use a single “annual average sunlight value.”
That is NOT accurate.
Solar varies month-to-month, and your financial return depends heavily on seasonal changes.
With SFS, when you select:
- Your State → Your County
You instantly get:
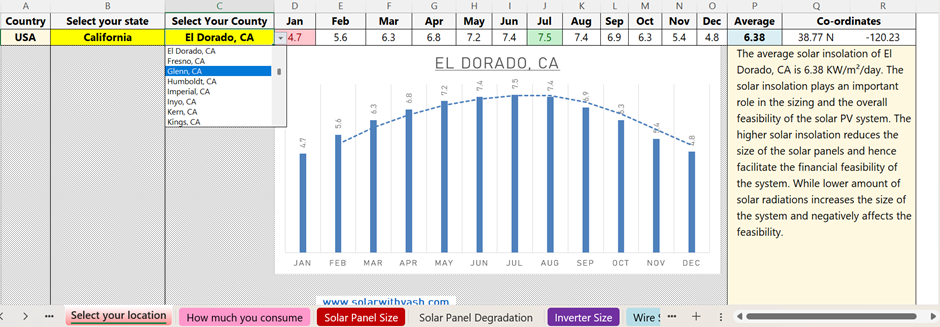
Because it uses county-level irradiance, it works as a highly accurate county-level solar calculator.
✔ 12-month Peak Sun Hours (PSH) values for your exact county
This gives you:
- realistic summer peaks
- accurate winter dips
- shoulder-season generation
- true monthly solar output
This monthly irradiance is the foundation of engineering-grade accuracy, not guesswork.
📅 Uses Your Actual 12-Month Electricity Bill — The Most Accurate Sizing Method
Most calculators assume your average bill is accurate.
But real homes have:
- AC-heavy summers
- winter heating variations
- seasonal habits
- high-load months
- low-load months
SFS uses your real 12-month bill to determine:
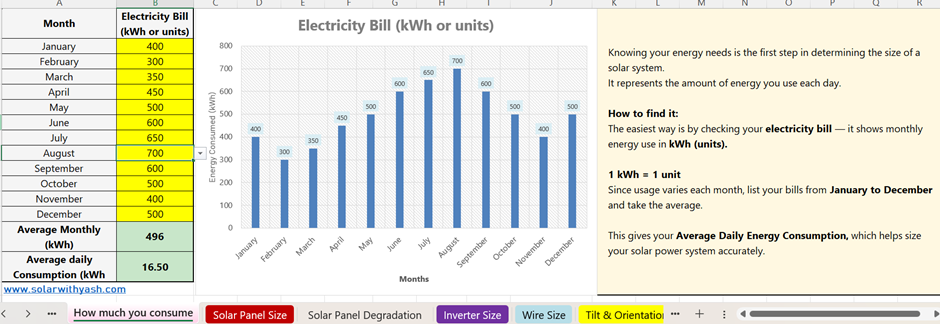
- correct system size
- correct DC capacity
- correct inverter size
- correct export/import balance
- true payback
- real ROI
This ensures the recommended system is not oversized or undersized — it is exactly right for your home.
🔧 Considers All Real-World System Losses
Solar panels do not produce their “ideal rated output.”
SFS includes all the important losses:
- temperature losses
- wiring losses
- dust/soiling
- system derating
- shading (light/medium)
- inverter inefficiency losses
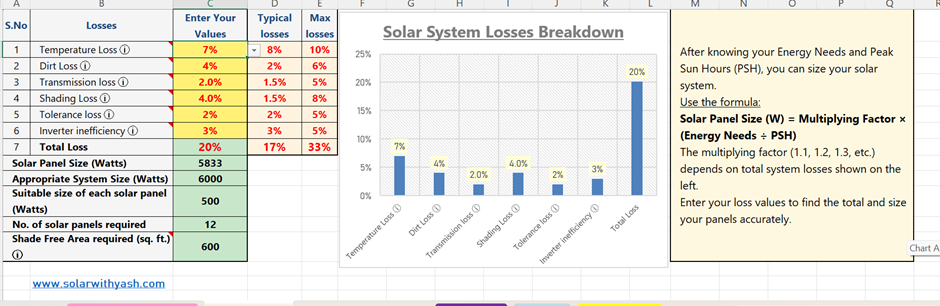
- panel degradation based on technology

Your final solar size is based on what your system will produce in real life, not a brochure.
🌡️ Inverter Sizing with Location-Based Temperature Adjustment
High-temperature states like:
- Arizona
- Texas
- Florida
- Nevada
…face higher thermal derating.
Cooler states like:
- Washington
- Minnesota
- Maine
…perform differently.
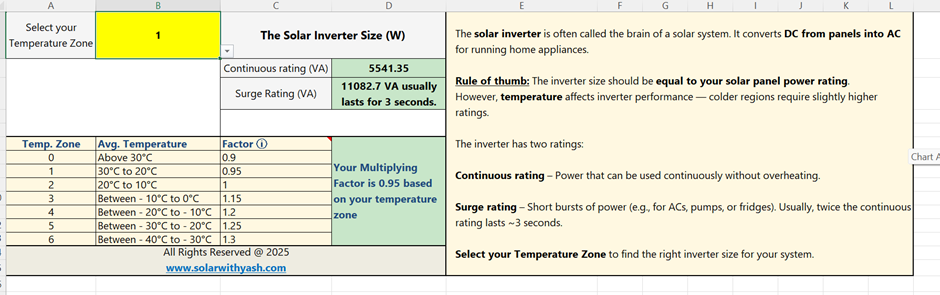
SFS adjusts your inverter recommendation based on your county’s typical ambient temperature, ensuring optimal DC/AC ratio and long-term performance.
📉 Advanced Panel Degradation Modeling (HJT / TOPCon / Mono-PERC / Poly)
Different solar panels degrade differently.
SFS allows you to choose your technology:
- HJT (0.25% per year)
- TOPCon (0.3% per year)
- Mono PERC (0.5% per year)
- Polycrystalline (0.7% per year)
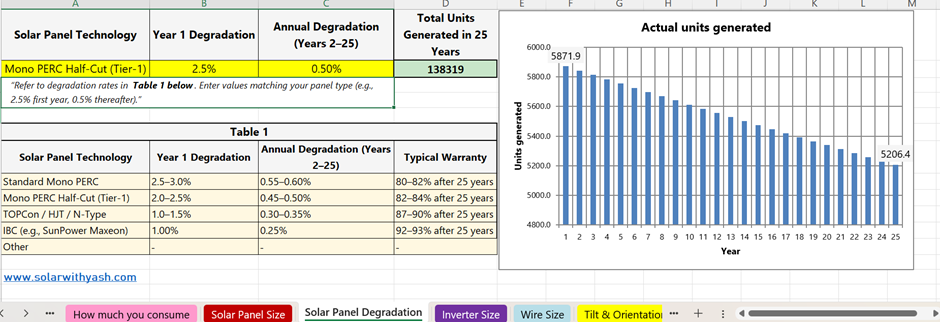
The tool recalculates:
- annual output
- lifetime production
- payback
- ROI
- LCOE (Solar cost per kWh)
This is the kind of modeling only professional consultants usually provide.
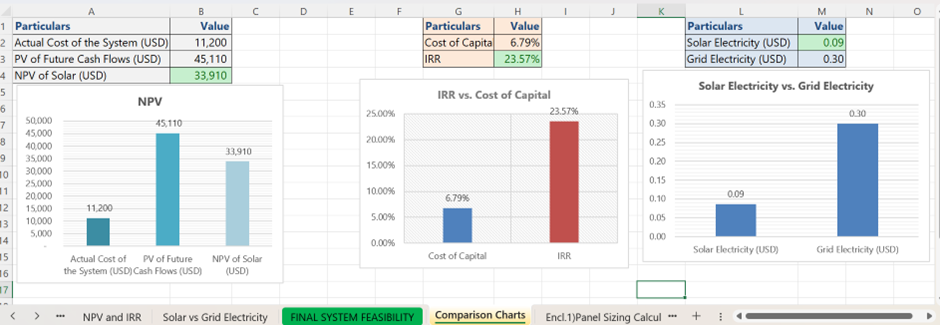
📉 Solar vs Grid Electricity Cost — Dynamic, Not Static
Electricity rates change every year.
But most calculators assume grid prices stay flat.
SFS includes:
- current grid rate
- annual grid escalation %
- solar maintenance escalation
- inverter replacement costs
- loan interest impact
- panel degradation
You get:
- ✔ True Solar Cost per kWh (LCOE)
- ✔ Real Grid Cost per kWh (future-adjusted)
- ✔ Accurate savings
- ✔ Bill reduction month-by-month
This is a complete financial comparison between solar electricity vs grid electricity.
🔁 Energy Flow Chart — Month-by-Month Production & Consumption
SFS gives you a 12-month energy chart showing:
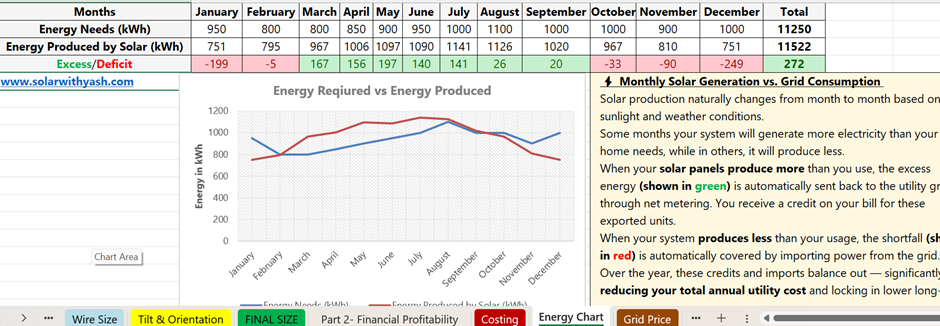
- solar generation
- home consumption
- export to grid
- import from grid
- Net (Export – Import)
You’ll know exactly:
- Which months you export surplus
- which months you import from the grid
- how much your bill will reduce each month
- how your credit/export behavior changes
No surprises.
No assumptions.
Just real data.
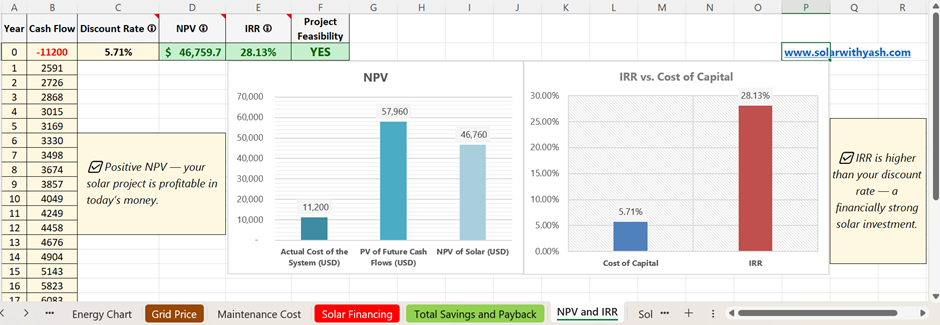
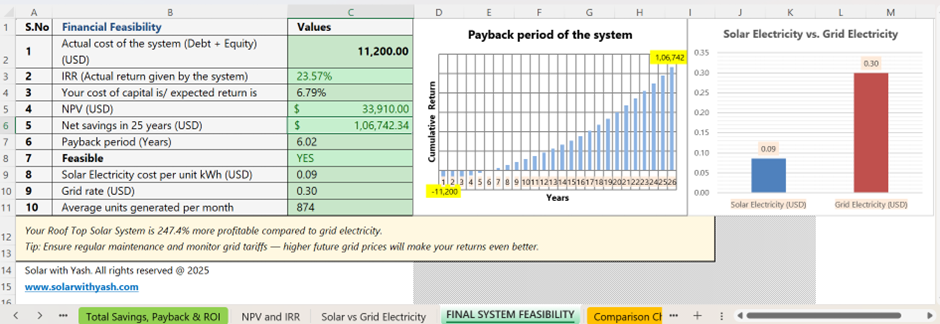
🧮 Advanced Financial Modeling — Equity, Debt, IRR, NPV, Discounted Payback
This is where SFS becomes a true financial feasibility tool, not a calculator.
SFS includes:
- 100% Equity (Cash Purchase)
- 50:50 Equity + Loan (Financing)
- Custom Loan Amounts
- Interest Rate Inputs
- EMI/Payment Calculations
- Impact of Interest on Total Cost
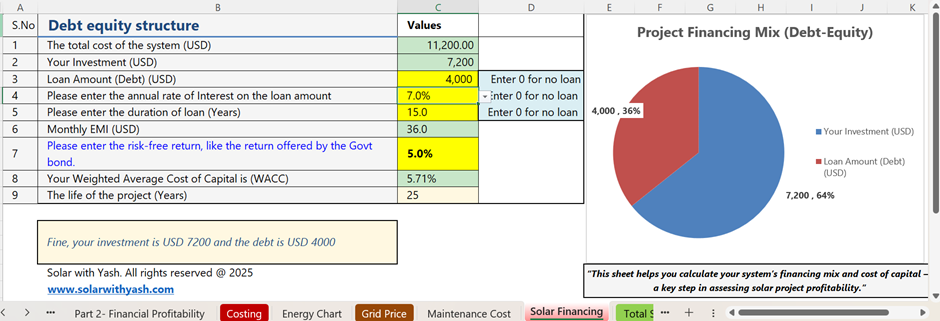
Every financial output updates instantly. The SFS also acts as a powerful solar NPV and IRR calculator, giving you investment-grade clarity.
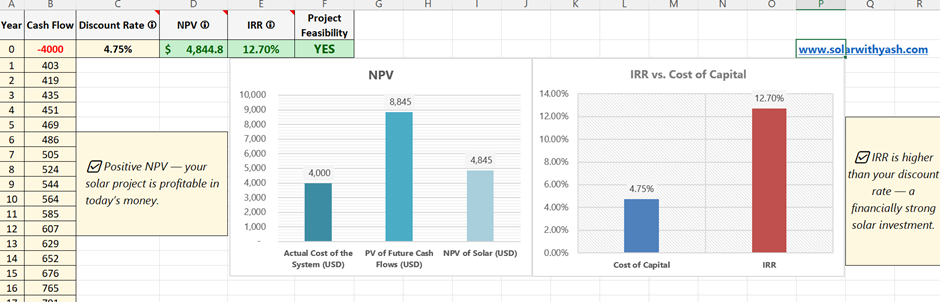
✔ IRR (Internal Rate of Return)
Shows your true return on investment —
just like real estate, stocks, or other assets.
✔ NPV (Net Present Value)
SFS discounts all future cash flows to tell you:
- the present-day value of your solar investment
- whether solar beats the stock market or not
- your true investment strength
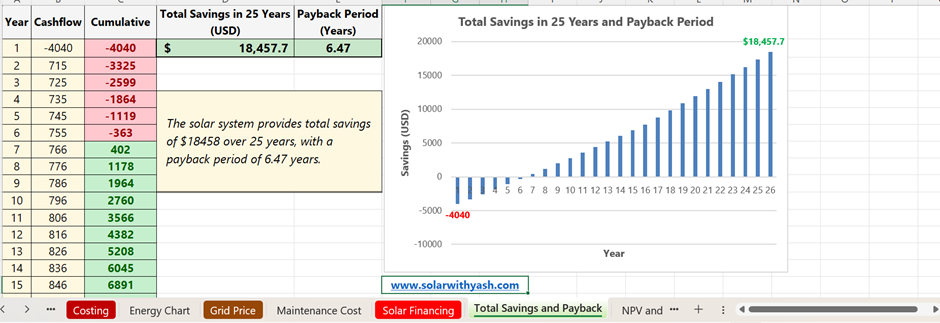
✔ Discounted Payback Period
Most calculators give misleading “simple payback.”
SFS gives discounted payback, which accounts for:
- grid escalation
- maintenance escalation
- loan interest
- inflation
- degradation
- discounted savings
This is the accurate payback financial analysts use.
✔ Loan Impact on Feasibility
Loan = extra cost.
But sometimes, solar is still profitable even with financing.
SFS shows:
- EMI
- interest paid
- reduced savings
- revised payback
- IRR with financing
- NPV after loan deduction
You get a clear picture of whether financing helps or hurts your ROI.
🧾 Lifetime Savings (20–25 Years)
The SFS computes:
- yearly savings
- yearly net cash flow
- cumulative savings
- discounted lifetime profit
- replacement costs
- maintenance over the years
You get a crystal-clear summary of your total lifetime financial benefit.
🟢 Feasibility Verdict — “Is Solar Worth It in Your County?”
After combining:
- county-level sunlight
- monthly bill
- losses
- degradation
- grid escalation
- Initial solar cost
- Maintenance cost
- financing
- inflation
- NPV
- IRR
SFS gives you a final feasibility verdict:
Solar is feasible / not feasible for your home in your county. This is what every homeowner wants — a final, trustworthy answer.
Comparison: SFS vs Other Solar Feasibility Tools
| Feature | Other Solar Feasibility Tools | Installer Quotes | SFS U.S. Edition |
|---|---|---|---|
| County-level PSH | ❌ | ❌ | ✔ |
| 12-month sunlight | ❌ | ❌ | ✔ |
| Real system losses | ❌ | ❌ | ✔ |
| Monthly import/export | ❌ | ❌ | ✔ |
| ROI, IRR, NPV | ❌ | ❌ | ✔ |
| Loan modeling | ❌ | ✔ (inflated) | ✔ (realistic) |
| Feasibility verdict | ❌ | ❌ | ✔ |
| Transparency | ❌ | ❌ | ✔ |
🌟 Trusted by Learners Around the World
★ ★ ★ ★ ★
“Excellent value and very clear explanations. The Solar Feasibility Spreadsheet is powerful yet surprisingly easy to use. Yash was extremely responsive and helpful. This tool gave me a solid understanding of solar payback and ROI — a great foundation for my future solar planning.”
— Leonardo Coll, Panama
★ ★ ★ ★ ★
“Very insightful and well structured. The spreadsheet made everything simple to analyze. Yash even added my country’s data, which made the whole process effortless. Highly recommended.”
— Madina A., Kazakhstan
💵 Before You Spend $10,000–$20,000 on Solar… Know Your Real Numbers
A residential solar system is a major investment.
Even a small mistake — like sizing incorrectly, misunderstanding ROI, ignoring financing impact, or trusting inflated installer claims — can cost you thousands.
The SFS costs less than 0.5% of a typical solar system,
but it can save you from:
- overpaying
- wrong sizing
- unrealistic savings promises
- poor-quality quotes
- choosing the wrong panel type
- taking a loan that reduces ROI
- misreading grid price impacts
For the price of a dinner, you make a financially confident decision.
💰 Pricing — SFS U.S. Edition (2025 Update)
The Solar Feasibility Spreadsheet U.S. Edition includes everything you need to evaluate your solar system with confidence — across all 3,100+ U.S. counties.
This edition includes:
- ✔ Data for all 3,100+ U.S. counties
- ✔ 12-month county-level Peak Sun Hours (PSH)
- ✔ 12-month energy consumption modeling
- ✔ Realistic system losses
- ✔ Monthly generation, export & import
- ✔ Optimal system size (kW)
- ✔ Panel count & roof area
- ✔ Inverter sizing by ambient temperature
- ✔ Wire gauge recommendation
- ✔ Tilt & orientation guidance
- ✔ Solar vs grid cost comparison
- ✔ Grid rate escalation modeling
- ✔ Maintenance escalation
- ✔ Panel degradation by technology (HJT / TOPCon / Mono-PERC / Poly)
- ✔ Cash purchase + loan feasibility
- ✔ EMI impact
- ✔ Discounted payback
- ✔ IRR & NPV
- ✔ Lifetime savings (20–25 years)
- ✔ Final Feasibility Verdict
- ✔ Instant Excel Download
- ✔ No subscription. Lifetime access.
- ✔ Free updates.
🎉 Intro Price: $59
One-time payment • Instant Excel Download • Lifetime use
Local taxes may apply

👉 One-time payment — no recurring fees.
👉 Works on Windows & Mac (Excel required).
👉 Download instantly.
👉 Use forever.
🤝 7-Day Money-Back Guarantee
I built the SFS to give homeowners absolute clarity before they spend thousands on solar.
Try the SFS for a full week.
If you feel it didn’t help you understand your solar payback, ROI, or savings —
just email within 7 days for a 100% refund.
- No hassle
- No questions
- No conditions
Your peace of mind matters more than the sale.
🌟 The Bottom Line — Solar Isn’t Just About Panels. It’s About Numbers.
Solar is an amazing technology.
But it becomes truly powerful when you understand the financial side clearly.
Before investing $10,000–$20,000 in a rooftop system, spend just 5 minutes with the SFS and know your:
- real sunlight
- real system size
- real production
- real bill savings
- real payback
- real ROI
- real lifetime savings
- real feasibility
- based on your exact county, your energy bill, and your conditions
Your county I Your consumption I Your numbers I Your decision.
SFS makes everything transparent.
One-time payment • Instant Excel Download • Lifetime Use • Free Updates
👉 In the U.S., $59 is less than a single dinner — but it protects a $20,000 decision.
🧩 Developed by Solar Design & Payback with Yash
Trusted by thousands of homeowners, students, and solar learners worldwide.
Helping you go solar with clarity, confidence, and precision.
FAQ — Solar Feasibility Spreadsheet (U.S. Edition)
1. What exactly does the SFS (U.S. Edition) do?
The SFS calculates your exact solar payback, savings, ROI, NPV, IRR, system size, monthly production, export, import, and feasibility using county-level PSH, your 12-month bill, and real system losses.
It gives you engineering-grade clarity before you invest in solar.
2. How accurate is the SFS?
Very accurate.
It uses:
- 12-month Peak Sun Hours (PSH) for all 3,100+ U.S. counties
- Real system losses
- Monthly generation calculations
- Degradation
- Grid-rate escalation
- Full discounted cash flow analysis
“Based on testing across multiple counties in different states, SFS results are typically within ±5–8% of NREL NSRDB values.“
3. Does it replace online solar feasibility tools and installer quotes?
Yes — it’s more accurate than both.
Online tools use state averages and simple formulas.
Installers often show optimistic numbers.
SFS shows realistic, county-specific, engineering-correct results.
4. Do I need solar knowledge or technical background?
No.
The file is designed for complete beginners but with professional-level accuracy.
Just enter your:
- State
- County
- 12-month bill
- System cost or installer quote
The spreadsheet does everything automatically.
5. Does the SFS work for every U.S. state and county?
Yes.
It includes data for all 50 states and 3,100+ counties, each with their own 12-month PSH.
6. Can I use this to compare different system sizes or installer quotes?
Absolutely.
You can enter any:
- Cost per watt
- System size
- Financing option
- Degradation level
- Grid rate
And the tool recalculates payback, ROI, IRR, NPV automatically.
7. Does it work on both Windows and Mac?
Yes — but Excel is required.
Google Sheets will not support all formulas and charts.
8. What if my utility rate is different from the default one?
You can change the electricity rate or escalation anytime.
The SFS will automatically recalculate your monthly savings and financial results.
9. Can the SFS model solar loans or financing?
Yes.
It supports:
- Cash purchase
- Partial loan (50/50)
- Full loan
- Any custom loan amount
- Interest, EMI, and repayment modeling
- IRR + NPV with financing
10. What about maintenance, inverter replacement, or degradation?
All included.
The SFS models:
- Annual maintenance
- Inverter replacement cost
- Degradation (HJT, TOPCon, Mono PERC, Poly)
- Inflation
- Grid-rate escalation
11. Is the purchase one-time or subscription?
It’s a one-time payment.
- No subscription
- No renewal fees
- No hidden charges
12. Do I get free updates?
Yes — You get lifetime free updates — including new PSH data, updated utility rates, refined formulas, and minor feature enhancements. All updates are delivered automatically to your email.
13. Can I use it for multiple properties or family members?
Yes — your purchase gives personal unlimited use for all your properties and your family.
14. Can solar sometimes be not feasible?
Yes.
The SFS gives an honest verdict.
If solar doesn’t make financial sense in your county or with your consumption, the tool will tell you that clearly.
15. What if I’m not satisfied?
You get a 7-day 100% money-back guarantee.
Just email—no questions asked.
16. Is support available if I get stuck?
Yes — you can email anytime for help or clarification.