Know your real solar payback, ROI, and long-term savings — before investing lakhs in rooftop solar.
Introduction
Solar in India looks attractive.
But most homeowners are still unsure.
Rooftop solar in India has grown rapidly over the last few years. Rising electricity tariffs, government subsidies, and falling panel prices have made solar appear like an obvious decision.
Yet, when it comes to actually signing the installation contract, many homeowners pause.
Common questions include:
- Is solar really worth it for my home, or does it only look good on paper?
- Are the payback numbers shown by installers realistic?
- How much system capacity do I really need—3 kW, 5 kW, or more?
- Does subsidy improve returns or only reduce upfront cost?
- Should I take a loan or pay fully in cash?
These are not overthinking questions. They are valid financial concerns—because most solar decisions in India are made using partial, optimistic, or incomplete calculations.
The real problem:
Solar decisions in India are made with half the picture
Most rooftop solar quotations and online tools in India share the same weaknesses:
- They use state-level average sunlight, ignoring district-level variation
- They oversize systems to inflate savings
- They focus on “payback period” while ignoring long-term value
- They ignore inverter replacement and lifecycle costs
- They treat subsidies as “free money” without long-term context
- They mix loan EMI affordability with project feasibility
As a result, many homeowners install solar without clearly understanding:
- the true cost of solar electricity
- the long-term cash-flow behavior
- the actual investment return
Solar works as a technology.
But solar works as an investment only when the numbers are evaluated correctly.
Introducing the Solar Feasibility Spreadsheet – India Edition

The Solar Feasibility Spreadsheet (SFS – India Edition) is a professional, decision-grade solar design and financial feasibility Excel-based tool designed to help homeowners make an informed solar decision before spending ₹2–5 lakh on a rooftop system.
SFS does not try to sell solar.
It helps you evaluate solar honestly.
“Designed by a solar engineer with 12+ years of experience reviewing hundreds of Indian rooftop projects”
It combines technical system design, location-specific energy estimation, and real financial feasibility into a single transparent model.
What SFS does — and why it matters?
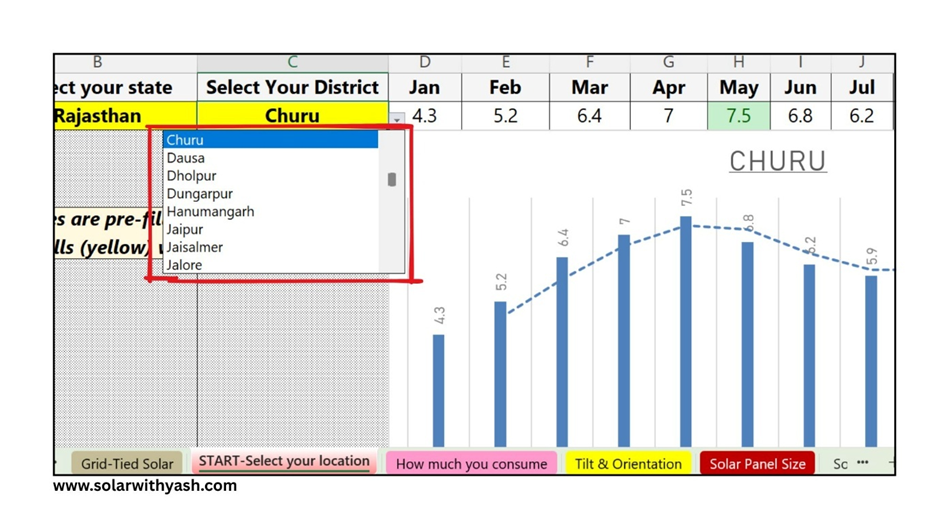
1️⃣ Uses district-level solar data (not state averages)
Solar generation in India varies significantly — not just between states, but within the same state. Most solar feasibility tools assume a single “average sunlight value” for an entire state. In reality, this is a major oversimplification.
Indian states such as Rajasthan, Maharashtra, Madhya Pradesh, and Uttar Pradesh are geographically large and climatically diverse.
Solar potential can vary meaningfully from one district to another within the same state.
For example:
- Coastal districts often receive lower effective solar radiation due to higher humidity, cloud cover, and sea-breeze effects. Ratnagiri PSH: 5.06
- Inland districts in the same state may have clearer skies and higher Peak Sun Hours (PSH). Pune PSH: 5.35
(Both Pune and Ratnagiri are in the same state, Maharashtra, but have different PSH values)
- Terrain, elevation, and regional weather patterns further influence solar availability
As a result, two homes located in the same state — even with similar electricity consumption — can experience very different solar generation and financial outcomes.
The Solar Feasibility Spreadsheet (SFS) addresses this problem by using district-level Peak Sun Hours (PSH) instead of broad state averages.
This leads to:
- More realistic generation estimates
- Better payback and ROI accuracy
- Fewer surprises after installation
By accounting for real geographic variation within each state, SFS provides a location-accurate foundation for both system sizing and financial feasibility.
In short, SFS does not assume that an entire state receives the same sunlight — it reflects the actual district-level solar reality.
2️⃣ Sizes the system using your actual electricity usage (not rules of thumb)
SFS starts with your actual electricity consumption, not assumptions. You enter your last 12 months of electricity usage, which allows the model to capture:
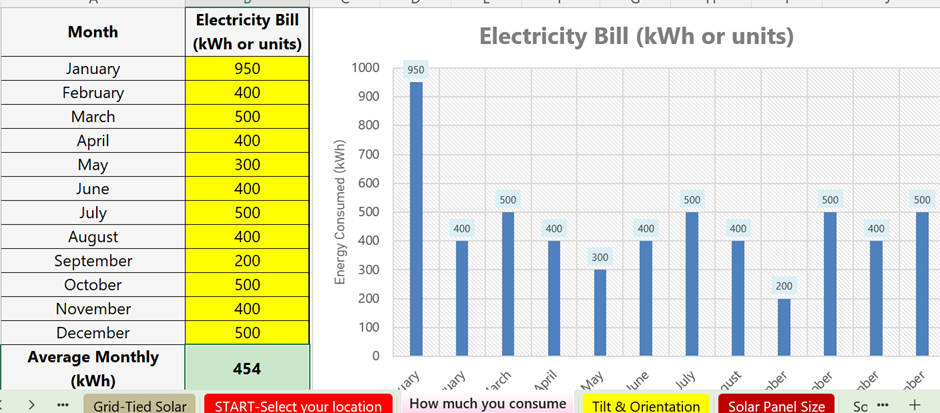
- Seasonal variation
- Base load vs peak usage
- Real annual energy demand
Based on this, SFS calculates:
- The appropriate system size (kW)
- Approximate number of solar panels
- Expected annual solar generation
This avoids two widespread mistakes in rooftop solar design:
- Oversizing, which increases upfront cost but often delivers limited additional savings due to export limits and low self-consumption
- Undersizing, which reduces long-term savings and underutilizes the rooftop potential
Going beyond simple sizing: technology, losses, and degradation
Unlike basic calculators, SFS does not assume that all solar panels behave the same. It allows you to account for solar panel technology, such as:
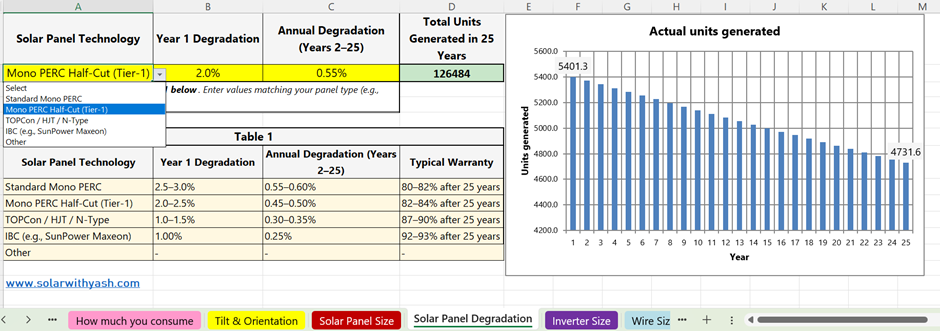
- Mono PERC
- Half-cut modules
- HJT and other high-efficiency technologies
Different technologies degrade at different rates over time.
SFS applies technology-appropriate degradation assumptions, so:
- Better technology → lower degradation
- Lower degradation → higher lifetime generation
- Higher lifetime generation → better long-term savings
This directly affects both system sizing and financial outcomes.
Realistic loss modeling for realistic output
SFS also accounts for key system losses that are often ignored or oversimplified, such as:
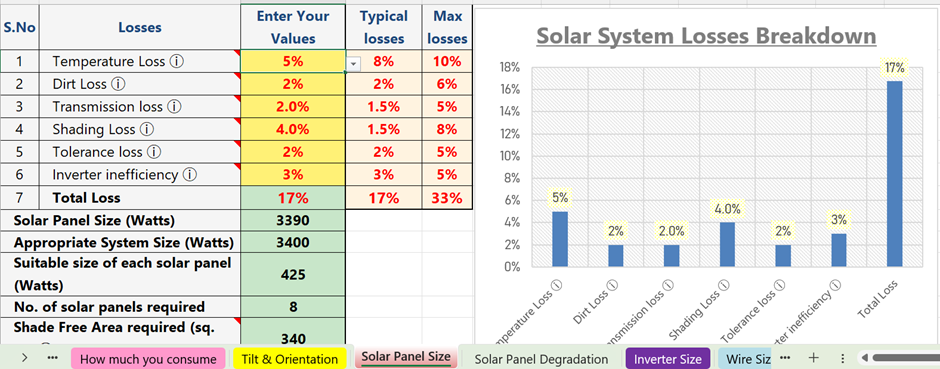
- Temperature losses
- Shading losses
- Inverter efficiency losses
- Other balance-of-system inefficiencies
By considering these losses explicitly, SFS avoids optimistic generation estimates and ensures that:
- System size is not understated
- Expected output reflects real operating conditions
- Financial projections remain realistic over the full project life
Why these matters?
Correct system sizing is not just about matching today’s consumption.
It requires understanding:
- How the system performs in real conditions
- How output changes over time due to degradation
- How losses affect usable energy
SFS integrates usage data, technology selection, losses, and degradation into a single sizing framework — so the system is designed for real-world performance, not marketing targets.
3️⃣ Correct inverter sizing using Indian temperature conditions
One of the most ignored aspects in rooftop solar design is the temperature impact on inverter sizing.
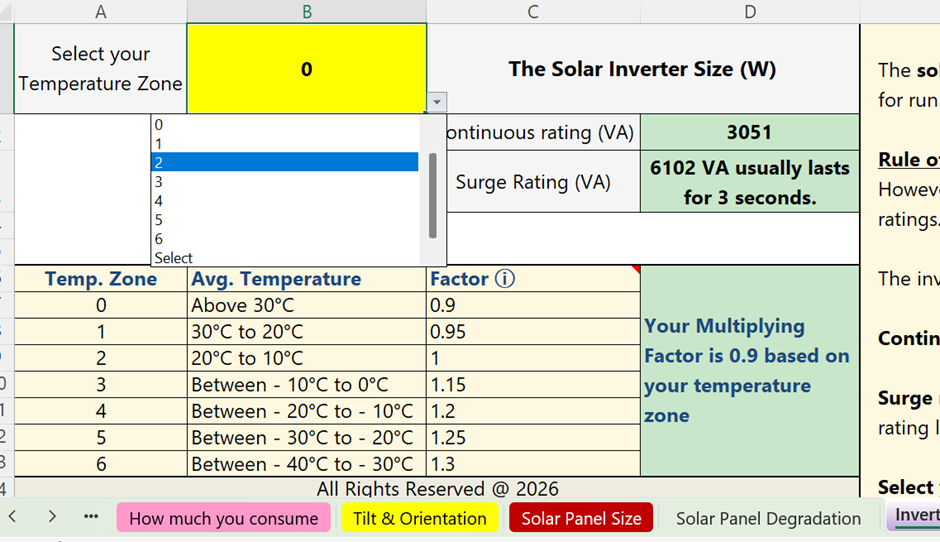
Most solar feasibility tools:
- Size inverters only on nameplate capacity
- Ignore high ambient temperatures common in India
SFS explicitly accounts for:
- Local temperature conditions
- DC/AC ratio implications
- Inverter derating and stress
This ensures the inverter is technically correct and durable, not just the cheapest option on paper.
4️⃣ Real-term financial modeling (no inflation illusion)
Many professional solar feasibility tools show savings increasing every year by assuming rising electricity tariffs. What they often fail to show is that this “growth” is largely inflation, not real value.
SFS uses inflation-adjusted (real) financial modeling, which means:
- All savings are expressed in today’s rupees
- No artificial inflation of future cash flows
- Proper discounting reflects the time value of money
What you see is real economic value, not inflated projections.
5️⃣ Lifecycle costs included — not hidden
Most payback calculations ignore long-term costs.
SFS explicitly models:
- Annual maintenance
- Inverter replacement during the project life
- Other realistic lifecycle costs
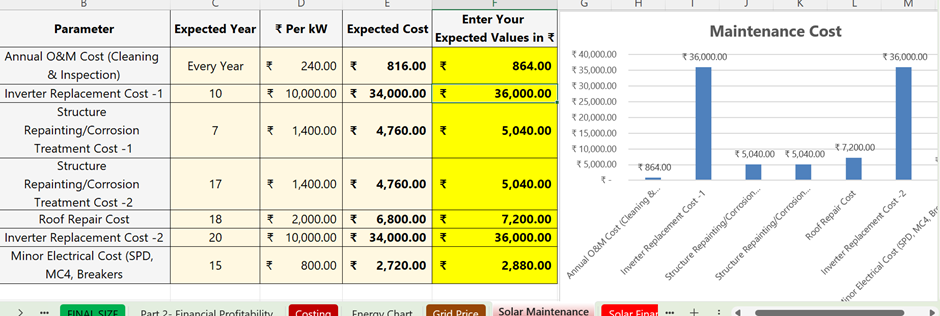
This leads to:
- Honest payback periods
- Realistic ROI
- Fewer unpleasant surprises in later years
Solar lasts 25 years.
Your analysis should too.
6️⃣ Subsidy impact shown clearly (without distortion)
A subsidy reduces the upfront cost—but it does not magically increase long-term savings.
SFS allows you to see:
- How subsidy affects initial investment
- How it changes payback and ROI
- What happens when subsidy assumptions change
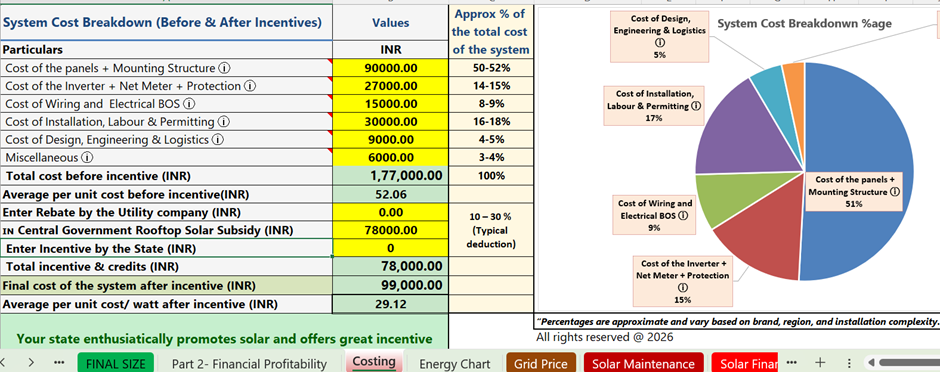
This prevents common misconceptions around “free returns”.
7️⃣ Cash vs loan: the most misunderstood solar decision in India
In India, many homeowners reject good solar projects because:
“EMI is too high.”
And others accept poor projects because:
“EMI looks manageable.” Both are mistakes.
SFS clearly separates:
- Project feasibility → Is solar a good investment?
- Financing impact → Can I afford it, and how does debt change cash flow?
You can see:
- EMI vs savings year-by-year
- How debt affects cash flow stress
- Whether solar remains financially sensible with a loan
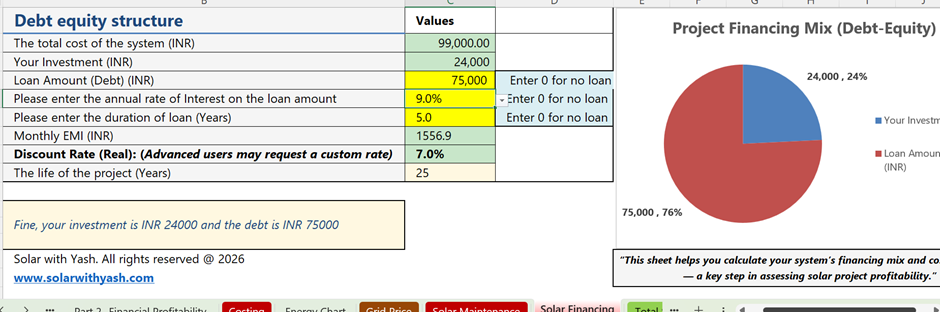
This clarity is critical in India, where financing choices strongly influence decisions.
Why the payback period often misleads Indian homeowners
Payback period is easy to understand—but dangerously incomplete.
It ignores:
- Electricity export limits
- Degradation of panels
- Inverter replacement
- Time value of money
Two systems with the same payback can have very different long-term value. SFS shows payback alongside NPV, ROI, and IRR, so decisions are based on value, not just speed of recovery.
India-specific examples: why location matters
📍 Delhi
High grid tariffs often make solar attractive, but oversizing rarely improves returns. SFS shows that correct system sizing matters more than capacity.
📍 Maharashtra
District-level PSH explains why Mumbai, Pune, and Nagpur produce very different results despite similar panel prices.
📍 West Bengal
Moderate sunlight makes realistic assumptions critical. Ignoring inverter replacement can distort payback by years.
What you get as output
SFS provides:
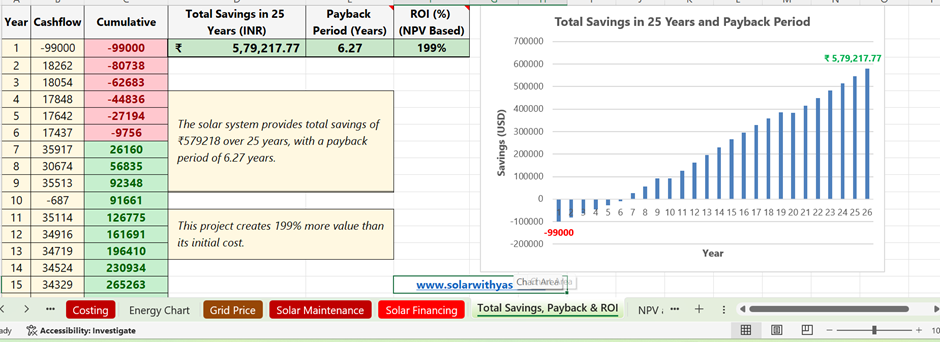
- Net Present Value (NPV)
- ROI (NPV-based)
- Internal Rate of Return (IRR)
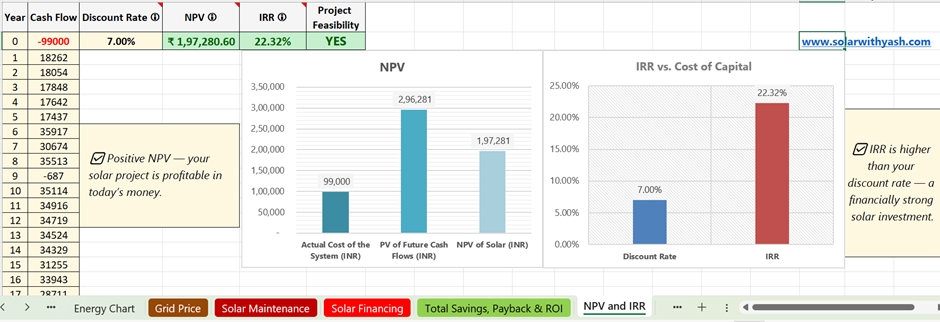
- Discounted payback period
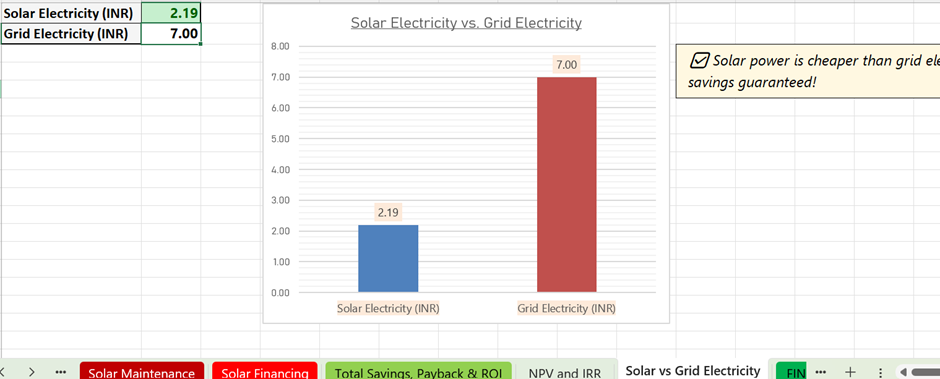
- Cost of solar electricity (₹/unit)
- Grid vs solar electricity comparison
- Year-by-year cash flows
- A clear feasibility verdict
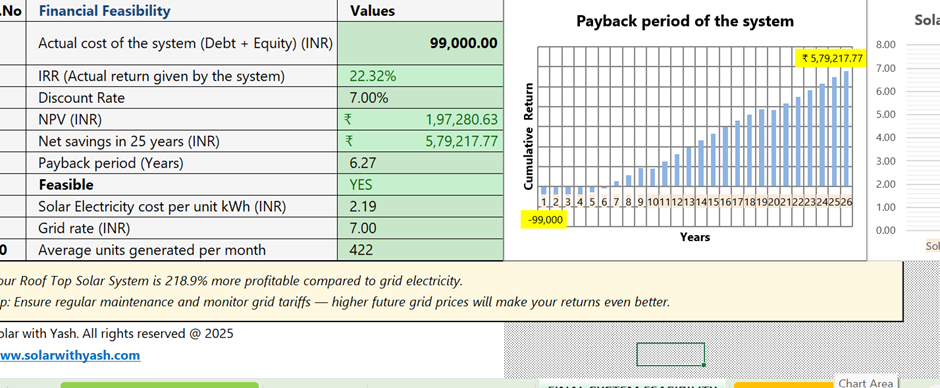
These outputs allow you to evaluate solar as a long-term investment, not just a utility upgrade.
Who should (and should not) use SFS?
SFS is ideal for:
- Homeowners planning rooftop solar
- People comparing solar with other investments
- Buyers who want to audit installer quotations
- Engineers and finance-aware users who want transparency
The SFS is not designed for:
- Quick marketing estimates
- “Guaranteed savings” claims
- One-size-fits-all calculators
SFS is for decision-making, not persuasion.
Pricing – India Edition
✔ One-time payment
✔ Excel download
✔ Lifetime access
✔ Free future updates

This is a fraction of the cost of a typical solar installation—and can save you far more by preventing poor decisions.
7-day money-back guarantee
Use the SFS for a full week.
If it does not help you understand your solar feasibility clearly, you can request a full refund within 7 days. No questions asked.
Final Thought
Solar is a powerful technology.
But it becomes a good investment only when the numbers are understood correctly.
Before spending lakhs on rooftop solar, spend a few minutes understanding the real numbers with the Solar Feasibility Spreadsheet – India Edition.
Frequently Asked Questions
1. Is this spreadsheet too technical for a homeowner?
No. SFS is designed for homeowners.
You only enter basic inputs like electricity bills, location, and system cost. All calculations run automatically.
2. Do I need engineering or finance knowledge to use SFS?
No. SFS applies engineering and financial logic in the background. You don’t need prior technical or finance knowledge to interpret the results.
3. Can I use SFS even if I already have a solar quotation?
Yes — in fact, that’s one of the best use cases.
You can input the quoted system size and cost and check whether the payback and ROI claims are realistic.
4. Does SFS guarantee that solar will be profitable for me?
No.
SFS does not promise guaranteed savings. It shows realistic outcomes based on your inputs, including cases where solar may not be financially attractive.
5. Does SFS work for loan-based solar installations?
Yes.
SFS clearly shows how loans affect cash flow, EMI vs savings, and affordability — while keeping project feasibility separate from financing.
6. Does SFS consider subsidies and net-metering?
Yes.
You can include applicable subsidies and see how they affect cost, payback, and ROI.
7. Will this work for apartments or only independent houses?
SFS works best for individual rooftop systems (independent houses or villas).
8. Is this a one-time purchase or a subscription?
This is a one-time purchase.
You get lifetime access and free updates for the same edition.
9. What if I’m not satisfied after purchase?
You are covered by a 7-day money-back guarantee.
If SFS doesn’t help you understand your solar decision clearly; you can request a full refund.
10. Is this spreadsheet updated for Indian conditions? Yes.
The India edition uses district-level solar data, Indian cost structures, realistic degradation, lifecycle costs, and India-specific assumptions.