Solar Payback in Bihar (2026): Cost, Savings & ROI
Electricity costs in India have been steadily rising over the past decade, and Bihar is no exception. While residential electricity tariffs in the state vary by consumption slab, typical household rates range roughly between ₹3.8 and ₹7.8 per unit, depending on monthly usage and tariff category.
In addition to base tariffs, consumers also pay fixed charges and fuel adjustment costs, which can push the effective electricity price even higher over time. For many households, especially those running fans, coolers, or air-conditioners during the long summer months, electricity bills have become a noticeable part of monthly expenses.
At the same time, Bihar is geographically well-positioned to benefit from solar energy. The state lies in eastern India between approximately 24°N and 27°N latitude, a region that receives abundant sunlight for most of the year.
Studies indicate that Bihar receives approximately 280 sunny days annually and an average solar irradiance of 4.8– 5.3 kWh per square meter per day, which is more than sufficient for efficient rooftop solar power generation.
This combination of rising electricity prices and strong solar resources makes rooftop solar increasingly attractive for homeowners. In addition, government initiatives such as the PM Surya Ghar rooftop solar subsidy scheme are further reducing the upfront cost of installation, improving the financial case for solar systems.
But the key question remains: Is installing solar panels actually worth it in Bihar?
In this article, we will analyze Bihar’s solar potential, electricity tariffs, and a real-world example of a residential solar system to estimate the payback period, long-term savings, and how the economics vary across districts such as Gaya, Gopalganj, and Aurangabad.
Solar Payback in Bihar – Quick Summary
| Parameter | Typical Value |
|---|---|
| System Size | 5 kW rooftop solar |
| Annual Generation | ~7700 units |
| Annual Savings | ₹46,000 – ₹54,000 |
| Cost After Subsidy | ₹2.22 – ₹2.72 lakh |
| Payback Period | ~4.4 – 5.4 years |
| 25-Year Net Savings | ~₹9 – ₹10 lakh |
Solar Potential in Bihar
Bihar has favorable solar resource conditions for rooftop solar power generation. Located in eastern India between roughly 24°N and 27°N latitude, the state receives strong solar radiation for most of the year.
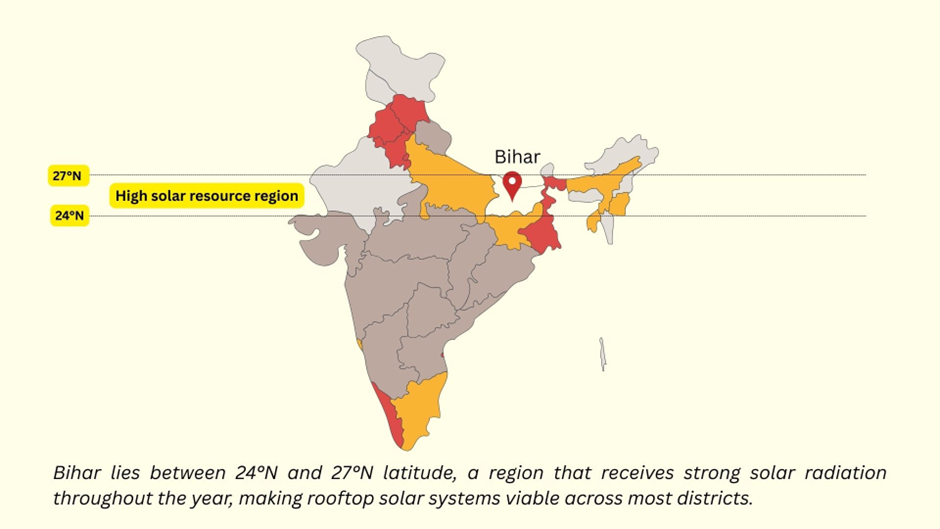
On average, many parts of Bihar receive 4.8-5.3 peak sun hours (PSH) per day, indicating that a well-installed rooftop solar system can generate a substantial amount of electricity annually.
Peak Sun Hours represent the equivalent number of hours per day when solar irradiance averages 1000 W/m², the standard testing condition used for solar panels. In practical terms, a 1 kW rooftop solar system in Bihar typically generates 4.8-5.3 units of electricity per day, depending on location, system efficiency, and rooftop orientation.
Example
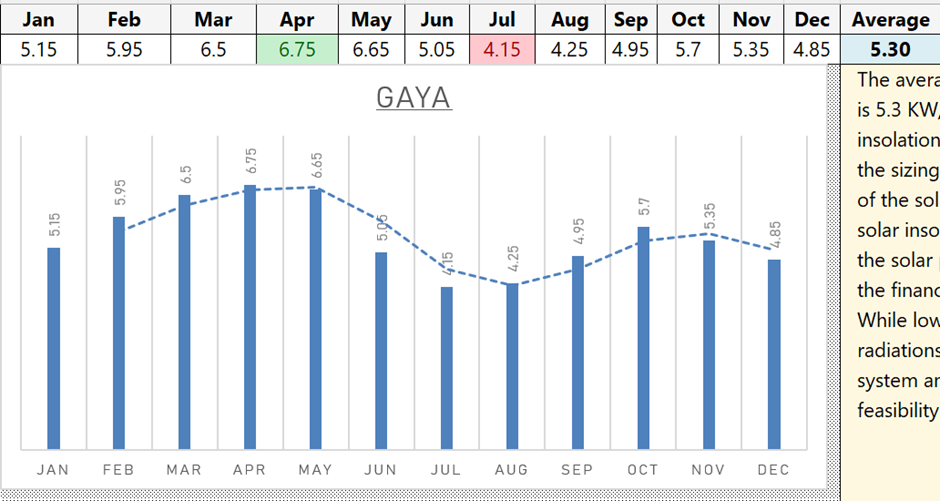
The example below shows the monthly solar irradiance pattern for Darbhanga district in Bihar. During the summer months (March to May), solar radiation is relatively high due to clearer skies and longer daylight hours. In contrast, the monsoon season (July to September) brings increased cloud cover, which temporarily reduces solar irradiance.
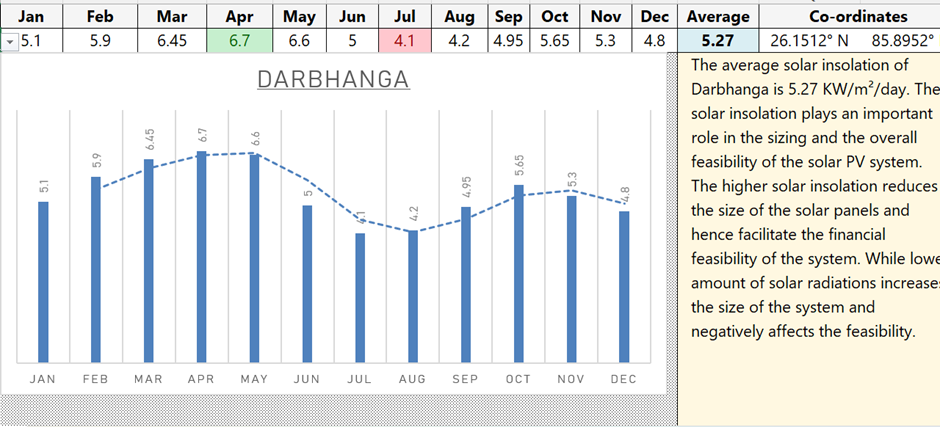
Assuming a typical residential performance ratio (PR) of 0.80, the annual generation can be estimated as:
- System size = 1 kW
- PSH = 5.27
- PR = 0.80
Annual generation ≈ 1 × 5.27 × 365 × 0.80 ≈ 1538 units per year
Despite this seasonal variation, the annual average solar resource in Bihar remains strong. However, real-world solar systems do not operate at 100% theoretical efficiency. After accounting for practical losses such as temperature effects, dust accumulation, wiring losses, inverter inefficiency, and occasional shading, a typical residential rooftop solar system operates at a performance ratio of around 75–80%.
When these losses are considered, a properly designed 1 kW grid-tied rooftop solar system in Darbhanga (Bihar) of about 5.27 peak sun hours can typically generate around 1500–1600 units of electricity per year.
Even with these practical losses, rooftop solar remains financially attractive for many homeowners because it can offset a significant portion of their annual electricity consumption.
Check Solar Potential for Your Rooftop
Not sure how much sunlight your rooftop receives?
You can estimate the solar potential of your location using my free tool: Solar Snap – Free Solar Sunlight Estimator
This tool helps homeowners quickly understand whether their rooftop is suitable for solar before contacting installers.
Electricity Tariff Analysis in Bihar
Before calculating solar savings, it is important to understand one key factor: your electricity tariff. The financial benefit of rooftop solar depends heavily on the price you currently pay for electricity.
In Bihar, residential electricity tariffs follow a slab-based structure. This means the cost per unit increases as your monthly consumption rises. For example, households consuming only a small amount of electricity may pay a relatively low tariff per unit, while homes with higher consumption move into more expensive slabs.
In addition to the energy charge per unit, electricity bills often include fixed charges and fuel adjustment costs, which can increase the effective price of electricity. As a result, the real cost of electricity for many households is often higher than the base tariff mentioned in the tariff schedule.
To understand the economics of solar, it is useful to estimate the effective electricity price that a typical homeowner in Bihar pays.
For many middle-class households running multiple fans, lights, refrigerators, and sometimes air-conditioners, monthly electricity consumption can range between 300 and 600 units. At this level of consumption, the effective electricity price often falls in the range of ₹6 to ₹7 per unit, depending on the tariff slab and additional charges.
This electricity price becomes the benchmark for calculating solar savings. Every unit of electricity generated by your rooftop solar system effectively replaces a unit that you would otherwise purchase from the grid.
Therefore, the higher your electricity tariff, the greater the financial benefit of solar.
Solar Subsidy in Bihar (PM Surya Ghar Scheme)
The financial attractiveness of rooftop solar in Bihar improves significantly because of the PM Surya Ghar: Muft Bijli Yojana, a national initiative aimed at encouraging households to adopt rooftop solar systems.
Under this scheme, the government provides a direct capital subsidy for residential rooftop solar installations, which reduces the upfront investment required from homeowners. The subsidy amount depends on the size of the solar system installed. For residential consumers, the subsidy is structured as follows:
- Up to 2 kW system: ₹30,000 per kW
- 2–3 kW portion: ₹18,000 per kW
- Maximum subsidy limit: ₹78,000 (for systems of 3 kW or larger)
This means a homeowner installing a 3kW rooftop solar system can receive a subsidy of about ₹78,000, while larger systems such as 4 kW or 5 kW continue to receive the same maximum subsidy amount.
The subsidy is transferred directly to the homeowner’s bank account after the solar system is installed and verified through the official national rooftop solar portal. Because the subsidy significantly reduces the upfront cost of the system, it plays an important role in improving the financial feasibility of rooftop solar.
For many households in Bihar, this support can shorten the solar payback period by several years, making rooftop solar an even more attractive long-term investment for reducing electricity bills and generating clean energy at home.
In the next section, we will use a practical example of a residential rooftop solar system to calculate how much electricity it can generate and how those units translate into real savings for a homeowner in Darbhanga, Bihar.
Example Solar System Calculation: Darbhanga (Bihar)
To understand whether solar is financially attractive in Bihar, let us walk through a simple example of a typical residential rooftop solar system.
Suppose a homeowner installs a 5kW grid-tied rooftop solar system in Darbhanga (Bihar). This size is quite common for Indian households that consume around 450–700 units of electricity per month. Such systems are large enough to significantly reduce electricity bills while still fitting on most residential rooftops.
The next step is estimating how much electricity this system can generate in Bihar.
As discussed earlier, Darbhanga receives 5.27 peak sun hours per day on average across the year. In practical system calculations, we also account for system losses such as inverter efficiency, temperature losses, wiring losses, and dust on panels.
The following chart illustrates a typical breakdown of system losses that reduce the real electricity output of a rooftop solar system.
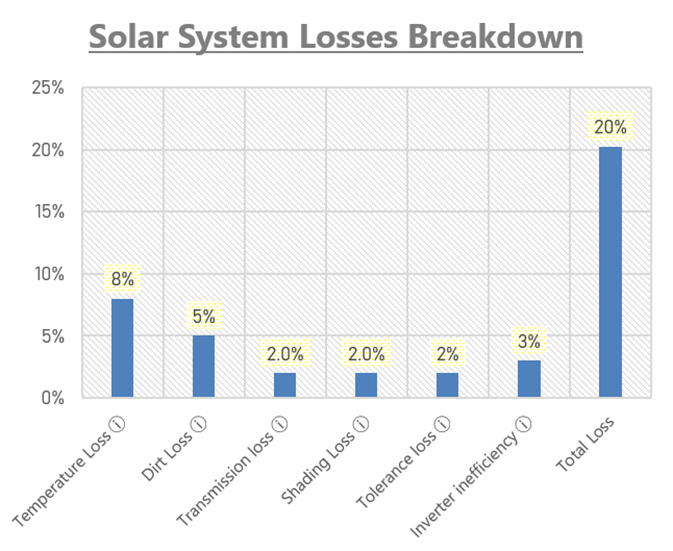
A typical residential system operates at an overall efficiency of around 80% of the theoretical output. Using these realistic assumptions, a 1 kW rooftop solar system in Darbhanga, Bihar can generate roughly:
5.27 x 1kW x 80% ≈4.2 units of electricity per day, average over the year.
This means a 5kW solar system can produce approximately 21 units per day (5kW x 4.2 units).
Over an entire year, this translates to roughly ≈ 7700 units of electricity.
Now think about what this means financially. Every unit generated by the solar system is a unit that the homeowner does not have to purchase from the grid.
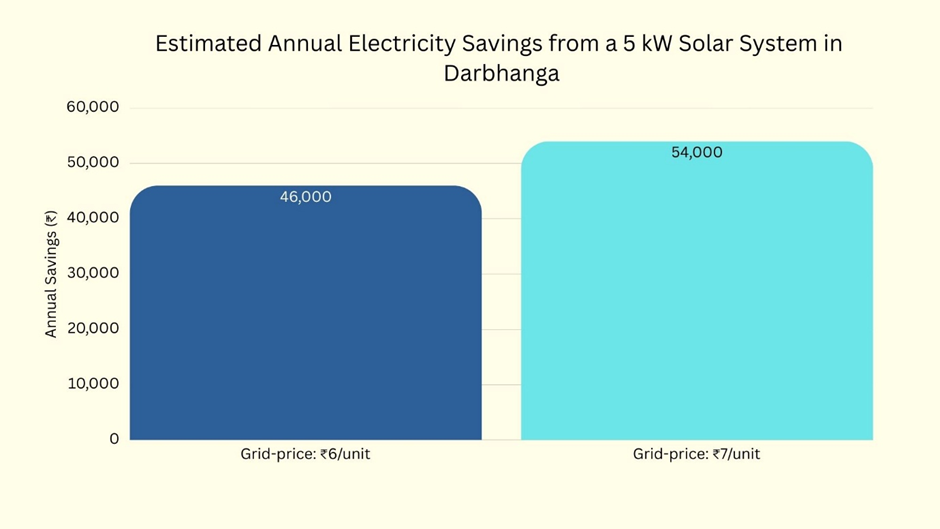
If the household electricity price is around ₹6–₹7 per unit, these solar units represent significant annual savings.
The annual savings could be in the range of ≈ ₹46000 to ₹54000. The following example illustrates how annual electricity savings change depending on the grid electricity price.
In the next section, we will use these numbers to calculate the payback period of a typical rooftop solar system in Bihar.
Payback Period of Rooftop Solar in Bihar
Now, let us use the numbers from the previous section to estimate the payback period of a typical rooftop solar system in Bihar.
Assume a homeowner installs a 5kW grid-tied rooftop solar system. In many cities of Bihar, the installed cost of such a system is typically around ₹3–₹3.5 lakh before subsidy, depending on equipment quality and installer pricing.
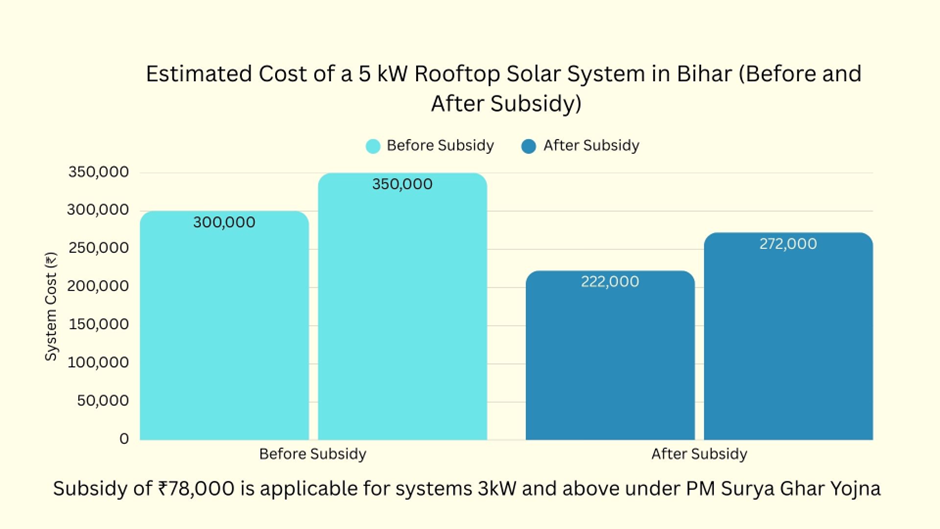
Under the PM Surya Ghar rooftop solar subsidy scheme, residential systems receive government subsidy support. For a 5kW system, the subsidy can reduce the upfront investment significantly. After applying the subsidy of ₹78,000, the effective cost of the system may fall to roughly ₹2.22 – 2.72 lakh.
The following chart illustrates how the government subsidy reduces the effective cost of a typical 5 kW rooftop solar system in Bihar.
Next, let us estimate the annual electricity savings.
As discussed earlier, a well-designed 5 kW solar system in Darbhanga, Bihar can generate roughly 7700 units of electricity per year. If the household electricity price is around ₹6–₹7 per unit, the annual savings from solar can be estimated as:
7700 units × ₹6.5 per unit (taking the average of ₹6 and ₹7) ≈ ₹50,000 per year
Now, we can estimate the simple payback period.
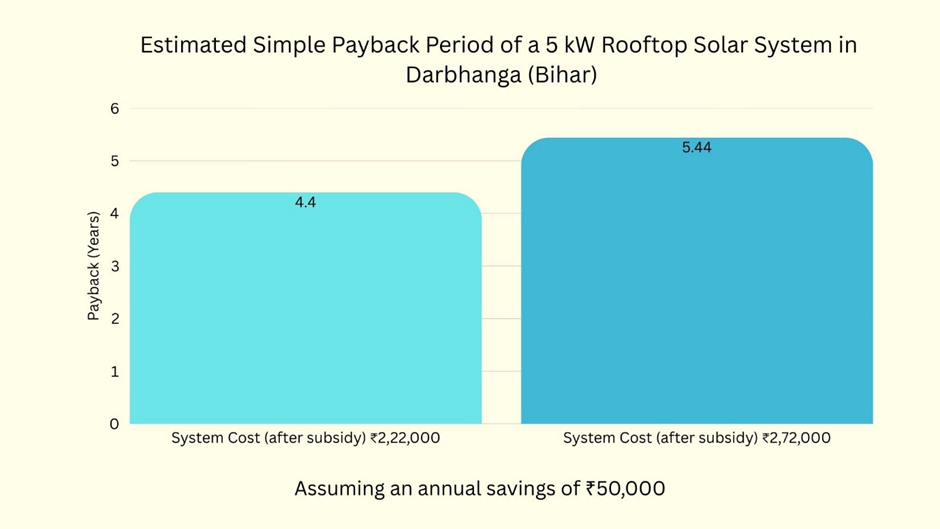
If the homeowner invests approximately ₹2.22 – 2.72 lakh after subsidy and saves about ₹50,000 per year, the payback period becomes:
4.44 years (₹2,22,000 ÷ ₹50,000) to 5.44 years (₹2,72,000 ÷ ₹50,000) In other words, the solar system may recover its investment in around 4.4 to 5.4 years under typical conditions.
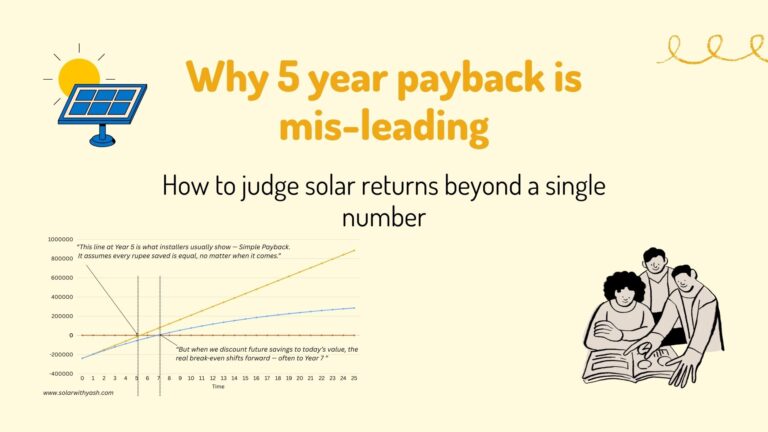
However, it is important to understand that payback is not a fixed number. It depends on several factors such as electricity tariff, system cost, solar generation, equipment replacement, and future tariff escalation.
If you want to calculate the exact payback for your home, you can use my Solar Feasibility Spreadsheet – India Edition and US Edition, which allows you to estimate solar savings based on location, tariff, and system size.
In the next section, we will look beyond payback and estimate the total savings a solar system can generate over its 25-year lifetime.
Solar ROI in Bihar
Return on Investment (ROI) measures how profitable an investment is compared to the money invested.
For a rooftop solar system, ROI can be estimated by comparing the total lifetime savings with the initial system cost.
Using the example discussed earlier:
- System cost after subsidy ≈ ₹2.22–₹2.72 lakh
- Estimated 25-year savings ≈ ₹12.5 lakh
- Net savings after cost ≈ ₹9–10 lakh
A simplified ROI estimate can be calculated as:
ROI = Net Profit ÷ Investment × 100
In this example:
ROI ≈ ₹9,78,000 ÷ ₹2,72,000 × 100 ≈ 360%
This means that over its lifetime, the solar system may generate more than three times the original investment in electricity savings.
However, the exact ROI will depend on several factors such as:
- electricity tariff escalation
- system maintenance costs
- inverter replacement
- actual solar generation
- Consumption Pattern
Because these factors vary from home to home, homeowners often use solar feasibility tools to estimate ROI more accurately before installing a system.
25-Year Savings from Rooftop Solar in Bihar
While the payback period tells us how quickly a solar system recovers its cost, it does not show the full financial impact of solar over its lifetime. Rooftop solar systems are long-term assets that typically operate for 25 years or more, which means the real value of solar comes from decades of electricity savings.
Let us continue with the same 5 kW rooftop solar system example.
As we estimated earlier, such a system in Bihar can generate roughly 7700 units of electricity per year. If the average electricity price is around ₹6.5 per unit, the annual electricity savings would be approximately:
7,700 × ₹6.5 ≈ ₹50,000 per year
Now imagine these savings continuing for many years. Over a 25-year lifetime, the total electricity generated by the system would be:
7,700 units × 25 years = 1,92,500 units of electricity
If electricity prices remained constant (which rarely happens in reality), the total savings would be:
1,92,500 × ₹6.5 ≈ ₹12.5 lakh
However, electricity tariffs usually increase gradually over time. Even a modest tariff escalation can significantly increase the lifetime savings of a solar system. With rising electricity prices, the real financial benefit of solar can be even higher. After subtracting the initial system cost of roughly ₹2.22–₹2.72 lakh, the net financial benefit over the system’s lifetime can easily reach ₹9.78 lakh or more under typical assumptions.
| Item | Value |
|---|---|
| System cost | ₹2.22–₹2.72 lakh |
| Annual savings | ₹50,000 |
| Payback | 4.4–5.4 years |
| 25-year savings | ~₹9–10 lakh |
This simple calculation shows why many homeowners view rooftop solar not just as an energy solution but also as a long-term financial investment.
In reality, solar systems may also involve occasional maintenance costs, such as inverter replacement, minor electrical repairs, and periodic system upkeep. When these long-term costs are included, the net lifetime savings may be somewhat lower than the simple estimate shown here. However, even after accounting for such costs, rooftop solar can still provide substantial financial benefits over its lifetime.
However, solar performance and economics can vary across locations.
Explore Solar Payback in Other States
Solar economics vary across India depending on sunlight and electricity tariffs.
You may also find these analyses useful:
- Solar Payback in West Bengal
- Solar Payback in Madhya Pradesh
- Solar Payback in Haryana
- Solar Payback in Delhi
These articles compare solar generation, tariffs, and payback across different regions.
In the next section, we will compare district-level variations in Bihar, including cities such as Gopalganj, Gaya, and Aurangabad, to see how solar generation can differ within the state.
District Variation: Gaya vs Gopalganj vs Aurangabad
One important point many homeowners do not realize is that solar generation is not exactly the same across all districts of a state. Even within Bihar, small variations in solar radiation, climate, and weather patterns can slightly affect how much electricity a rooftop solar system produces.
To understand this, let us compare three major districts: Gaya, Gopalganj, and Aurangabad.
In general, the southern parts of Bihar, such as Aurangabad, tend to receive slightly higher solar radiation compared to northern districts closer to the Himalayan foothills. This means solar systems in districts like Gaya may produce marginally more electricity over the year.
For example, based on typical solar resource estimates:
- Gaya may receive around 5.3 peak sun hours per day
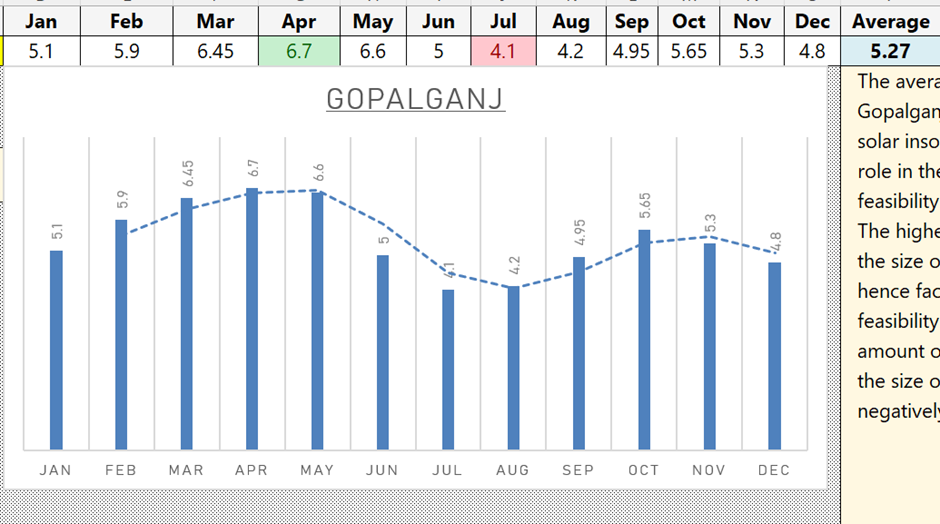
Gopalganj typically receives about 5.27 peak sun hours
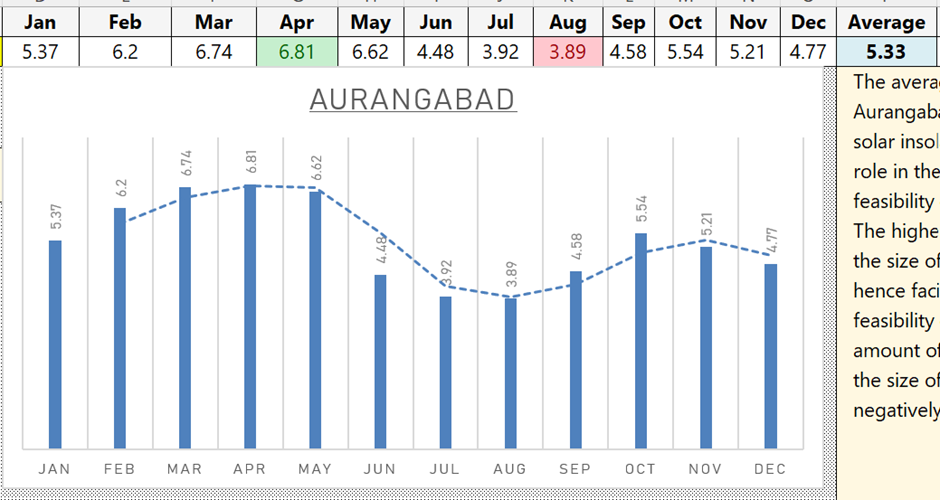
Aurangabad may receive roughly 5.33 peak sun hours
At first glance, these differences may appear small. However, when we convert them into annual electricity generation, they can create noticeable variations.
A 1 kW rooftop solar system may generate approximately when assuming a PR of 80%:
- Gaya: ~1550 units per year
- Gopalganj: ~1540 units per year
- Aurangabad: ~1560 units per year
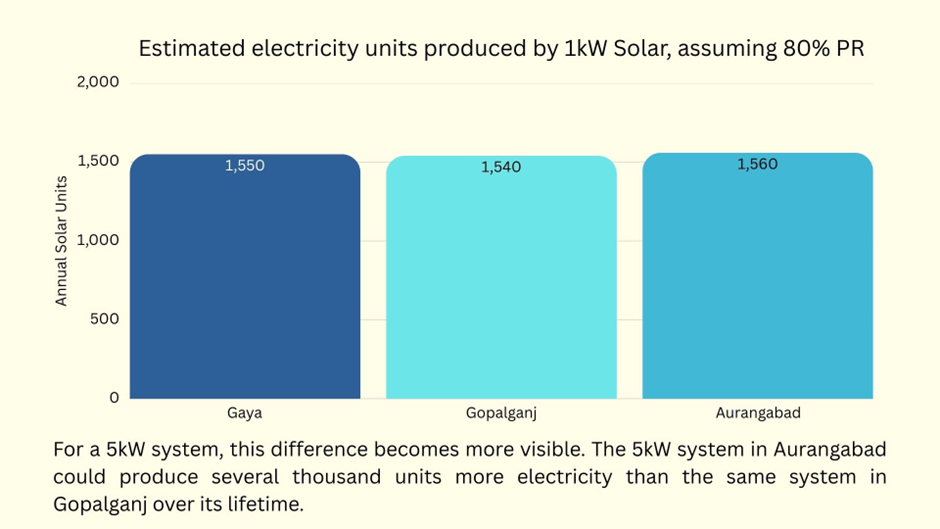
For a 5kW system, this difference becomes more visible. The system in Aurangabad could produce 2,500 additional electricity units than the same system in Gopalganj over its lifetime. However, it is important to note that these differences are relatively modest. In most parts of Bihar, solar resource conditions are strong enough to support good rooftop solar performance.
Before Installing Solar Panels – Do This
Many homeowners install solar without calculating the full financial impact.
A proper solar feasibility analysis should include:
- Electricity tariff trends
- Solar generation for your location
- System cost
- Inverter replacement cost
- Long-term ROI
If you want to evaluate solar like an investment, you can use the Solar Feasibility Spreadsheet to run these calculations in minutes.
In the next section, we will look at when installing solar panels makes the most financial sense for homeowners in Bihar.
When Solar Makes Sense in Bihar
After looking at generation, tariffs, and savings, the next logical question is: for which households does rooftop solar make the most sense in Bihar?
In general, solar becomes financially attractive when a household has moderate to high electricity consumption. If a family consumes around 300–600 units of electricity per month, a rooftop solar system can offset a large portion of their electricity usage. Because these households are usually paying higher tariff slabs, every solar unit generated replaces relatively expensive grid electricity.
Solar also works best when the house has a good rooftop with clear sunlight exposure. Ideally, the roof should receive sunlight for most of the day without major shading from nearby buildings, trees, or water tanks. Even partial shading can reduce system output, so rooftop conditions play an important role in the performance of a solar system.
Another important factor is the availability of net metering or grid connectivity. In grid-tied systems, any excess electricity produced during the day can be exported to the grid and adjusted against electricity consumption at other times. This improves the financial return of the system because very little solar generation is wasted.
Government subsidies also improve the economics significantly. Programs such as the PM Surya Ghar rooftop solar scheme reduce the upfront investment required from homeowners, which shortens the payback period and increases long-term savings.
For homeowners who have adequate rooftop space, moderate electricity consumption, and access to subsidies, rooftop solar in Bihar can become a financially attractive long-term investment.
However, solar may not be the best option in every situation. In the next section, we will examine when installing solar panels may not make financial sense for some households in Bihar.
When Solar May Not Make Sense in Bihar
Although rooftop solar can be financially attractive for many homeowners in Bihar, it is important to understand that solar is not the best option for every household. The economy depends on several practical factors.
First, solar may not make strong financial sense for households with very low electricity consumption. If a family uses only 100–150 units per month, their electricity bill is already relatively small because they remain in the lower tariff slabs. In such cases, even if a solar system generates electricity, the financial savings may not be large enough to justify the upfront investment.
Second, rooftop conditions can sometimes limit solar performance. Homes with heavily shaded rooftops, nearby tall buildings, or limited roof space may not be able to install an adequately sized solar system. If a rooftop receives sunlight for only a few hours per day, the electricity generation can drop significantly.
Third, solar economics can be affected by policy and regulatory conditions. For example, if net metering policies change or if export credits are reduced, the financial return of rooftop solar systems could be impacted. While rooftop solar policies in India are currently supportive, homeowners should always check the latest regulations before installing a system.
Finally, households planning to move to another property within a few years may not fully benefit from the long-term savings of a solar system, since most of the financial advantage comes over many years of operation.
For most homeowners with adequate electricity consumption and a suitable rooftop, solar in Bihar can still be a financially attractive investment. However, evaluating the specific conditions of each home is essential before making a decision.
Finally: Is Solar Worth It in Bihar?
Based on the analysis in this article, rooftop solar can be a financially attractive investment for many homeowners in Bihar.
A typical 5 kW grid-tied rooftop solar system can generate around 7700 units of electricity per year under typical conditions. At an average electricity price of about ₹6–₹7 per unit, this can translate into annual savings of roughly ₹50,000.
After applying the PM Surya Ghar subsidy, the installation cost of a 5 kW system may fall to around ₹2.22–₹2.72 lakh. With annual savings of about ₹50,000, the system can recover its investment in approximately 4.4 to 5.4 years.
Since rooftop solar systems typically operate for 25 years or more, homeowners may continue to benefit from electricity savings long after the initial investment is recovered. Even with conservative assumptions, the total net savings over the lifetime of the system can reach around ₹9–10 lakh or more.
Of course, the exact financial outcome will depend on factors such as electricity tariffs, rooftop conditions, solar generation, and maintenance costs. However, for many households with moderate to high electricity consumption and a suitable rooftop, solar power can be both an environmental and a financially rewarding investment in Bihar.
Thinking of Installing Solar in Bihar?
Before investing ₹2–3 lakh in rooftop solar, it is worth verifying the numbers.
The Solar Feasibility Spreadsheet (SFS) helps homeowners calculate:
- Exact solar generation for their location
- Payback period
- 25-year savings
- ROI compared with grid electricity
It is designed for homeowners who want data-driven solar decisions instead of installer estimates. Download the Solar Feasibility Spreadsheet
FAQ
How much electricity can a 1kW solar system generate in Bihar?
A 1 kW rooftop solar system in Bihar typically generates around 1500–1600 units of electricity per year, depending on solar irradiance, system efficiency, and rooftop conditions.
What is the cost of a 5kW solar system in Bihar?
A typical 5 kW grid-tied rooftop solar system may cost around ₹3–₹3.5 lakh before subsidy. After applying the ₹78,000 subsidy, the effective cost can fall to about ₹2.22–₹2.72 lakh.
What is the payback period of solar panels in Bihar?
Under typical conditions, the payback period for a 5kW rooftop solar system in Bihar is around 4.4–5.4 years, depending on electricity tariffs and installation cost.
How long do rooftop solar panels last?
Most rooftop solar panels have a lifespan of 25 years or more, although inverters may require replacement after 10–12 years.
What is the real payback of solar?
The real payback depends on the electricity tariff, solar generation, system cost, maintenance cost, equipment replacement cost, and consumption pattern. To calculate it accurately, many homeowners use a solar feasibility spreadsheet.