
The solar panels performance reduced further in December
Our 5-kW solar power system produced 315.2 kWh of energy in December.
It was 17% less than the previous month and almost 50% less than the energy produced in September.
Let us look at the performance of 5 kW solar in December.
Okay, before looking into the performance let us know the basic workings of a grid-tied solar power system.
The grid-tied solar power system
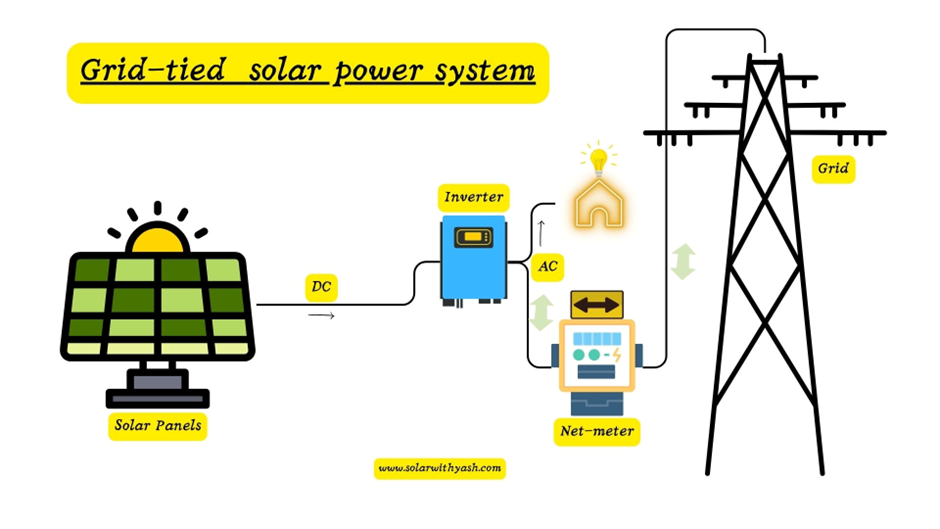
Although my readers know this, in case you are new to this blog and the solar PV technology.
Then let me brief you about the working of this technology.
The sunlight is absorbed by the solar panels and converted into electricity or to be precise direct current.
But most of our electrical appliances run on alternating current.
The inverter does this job.
It takes in the solar panels’ direct current, converts it into alternating current, and then feeds to our electrical appliances.
And we see our fans, washing machines, LEDs running and glowing.
The extra units if left unused are fed to the grid through a net-meter. The net meter is a device that allows the bi-directional flow of energy between the solar panels and the grid. It records the net flow of the energy.
The extra energy from the solar panels is fed to the grid through this net meter and the user is compensated for this with a reduced electricity bill.
The energy produced by a 5-kW grid-tied solar power system in December
The energy produced by a 5-kW grid-tied solar power system in December
December has 31 days.
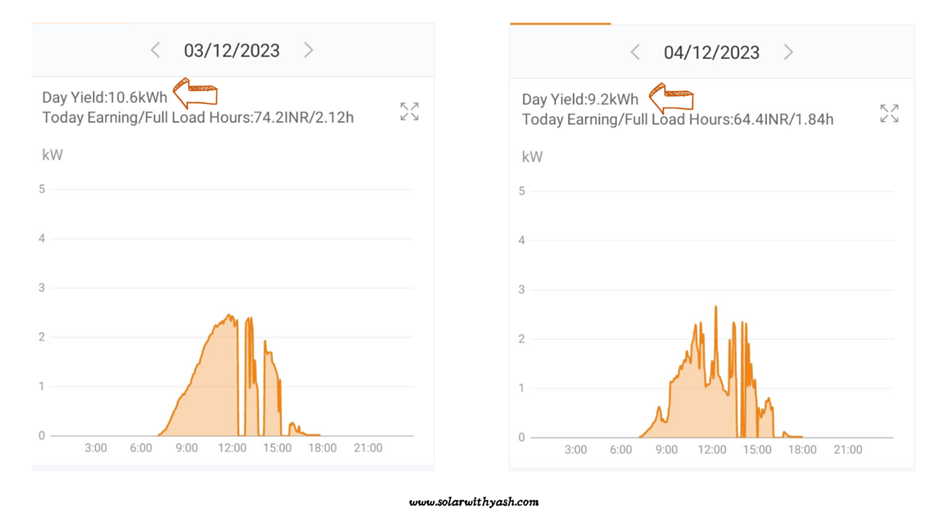
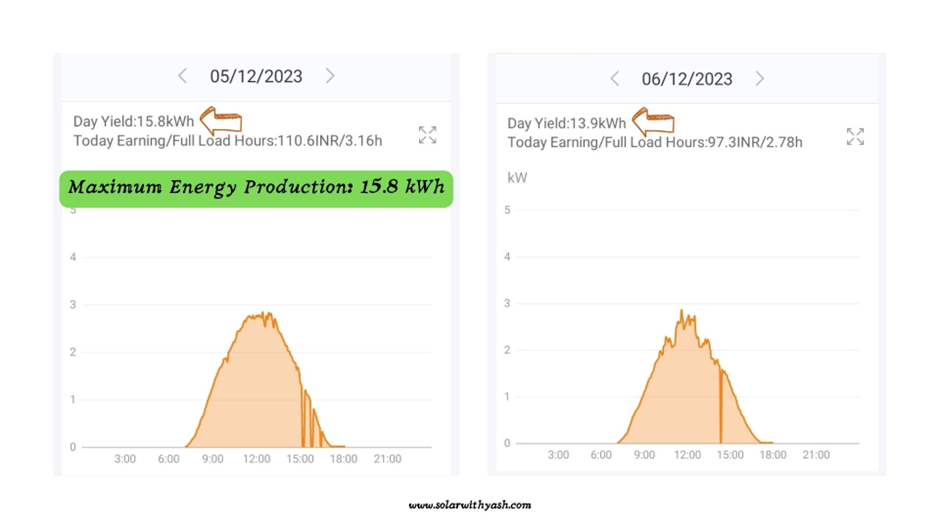
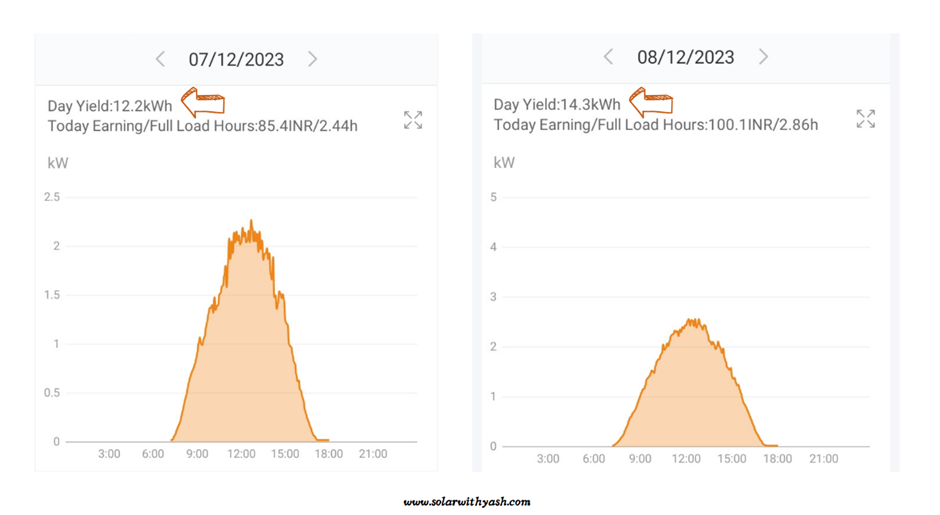
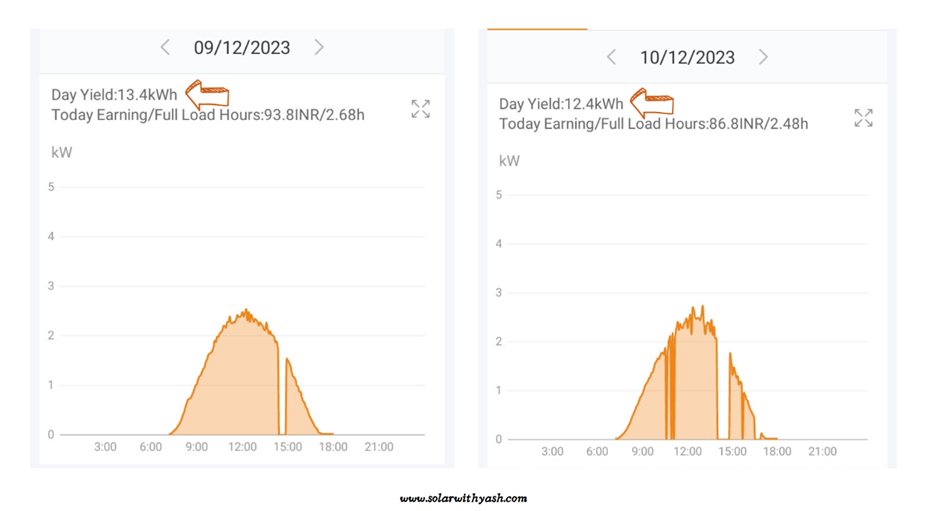
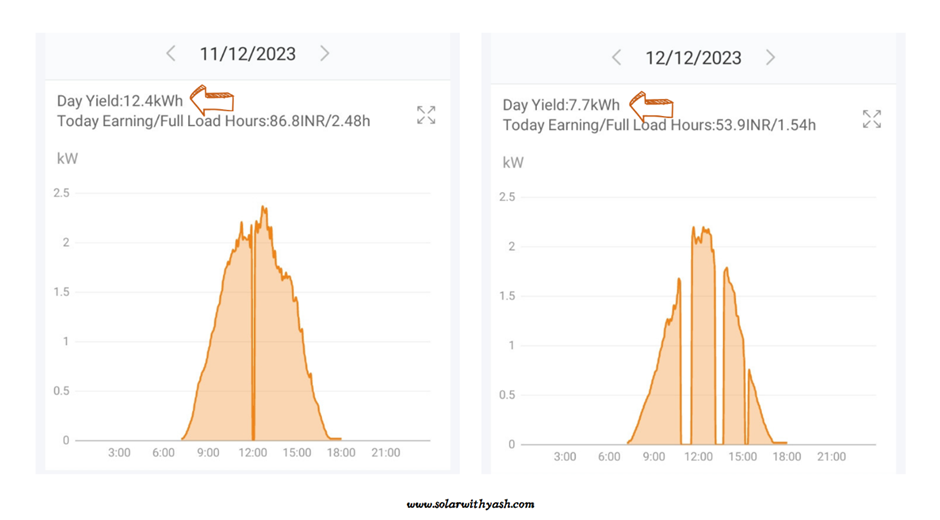
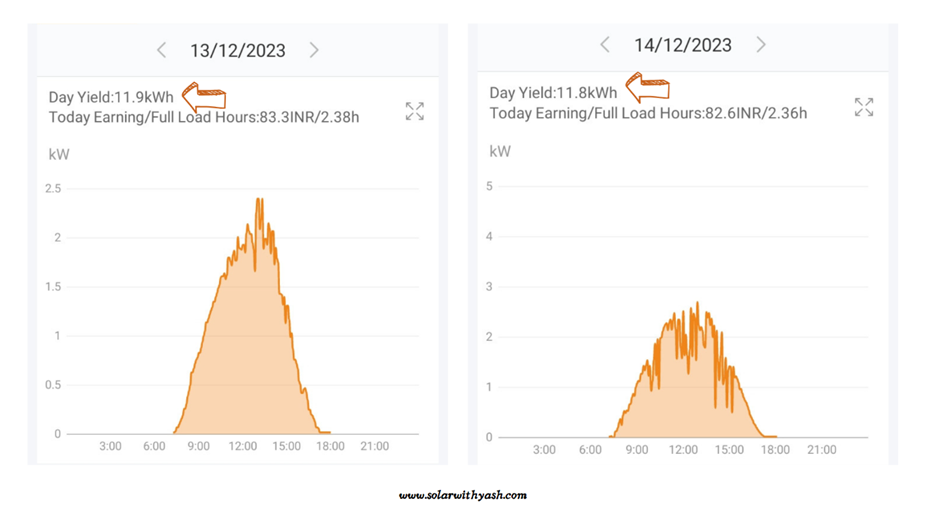
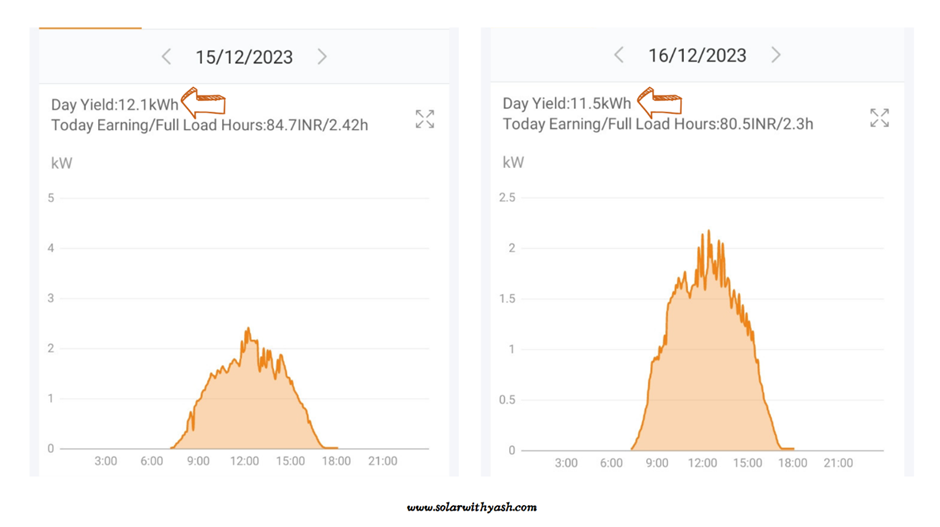
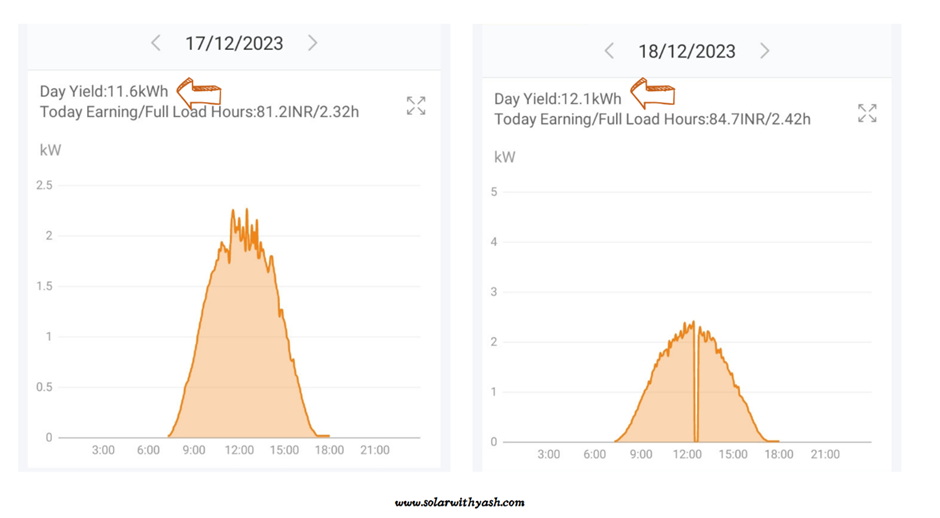
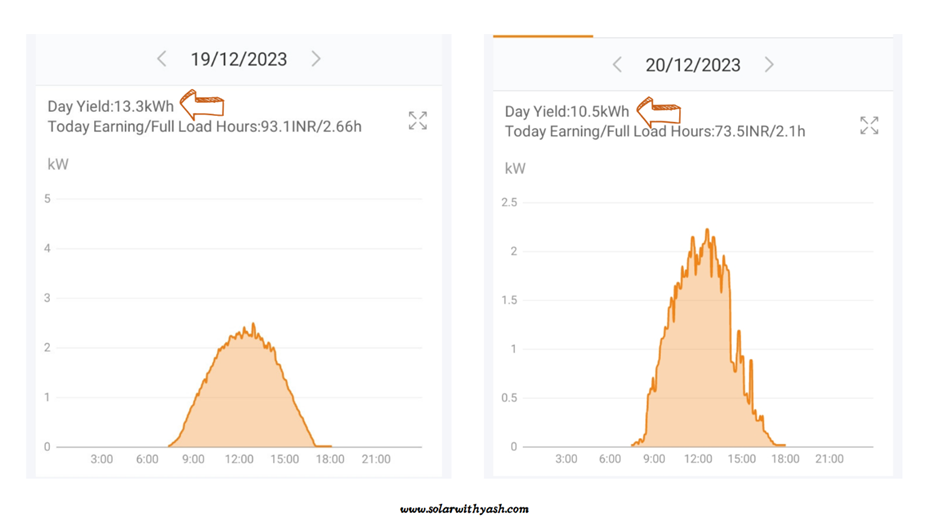
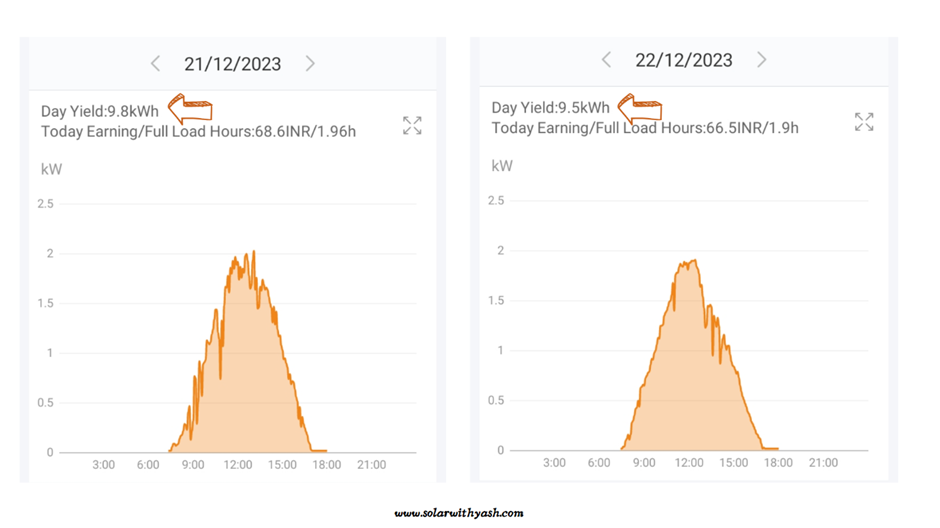
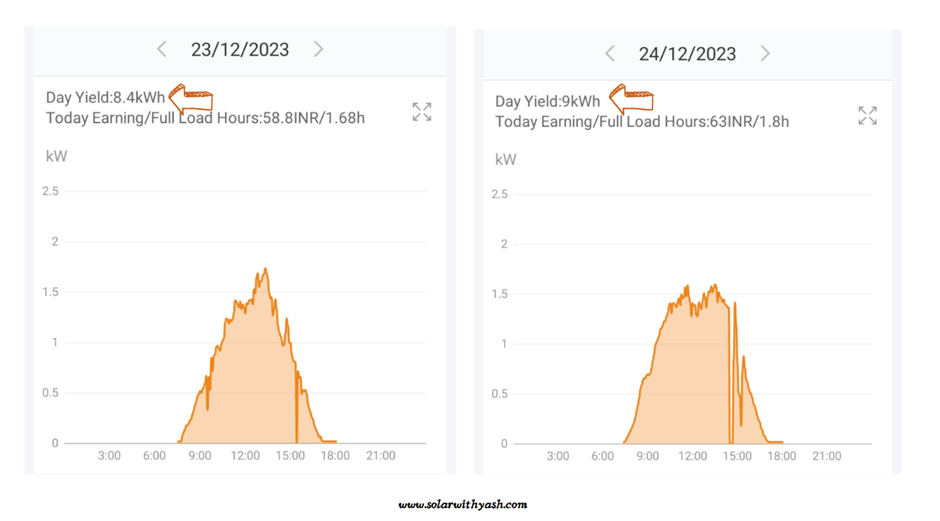
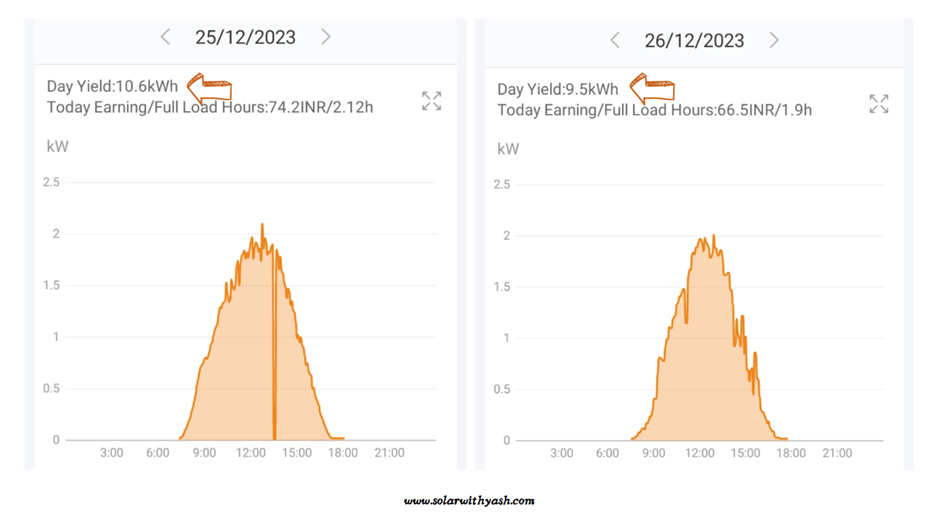
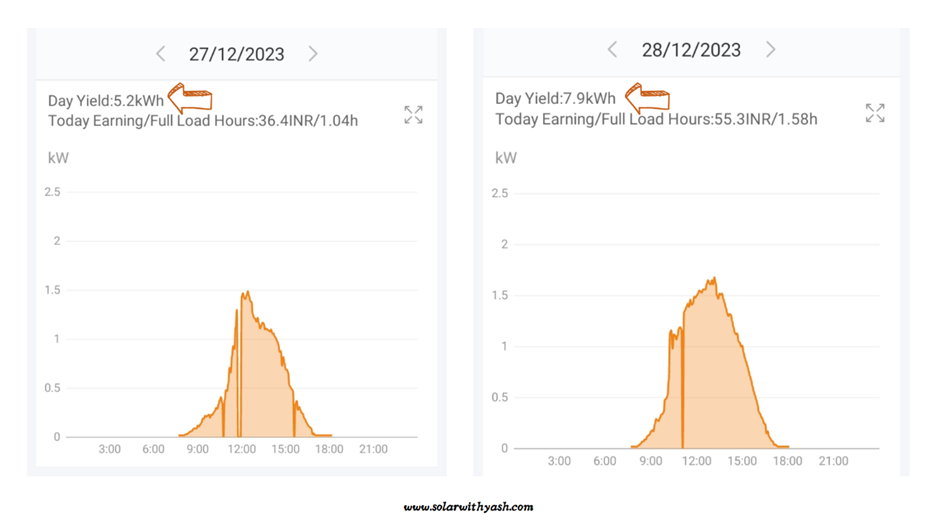
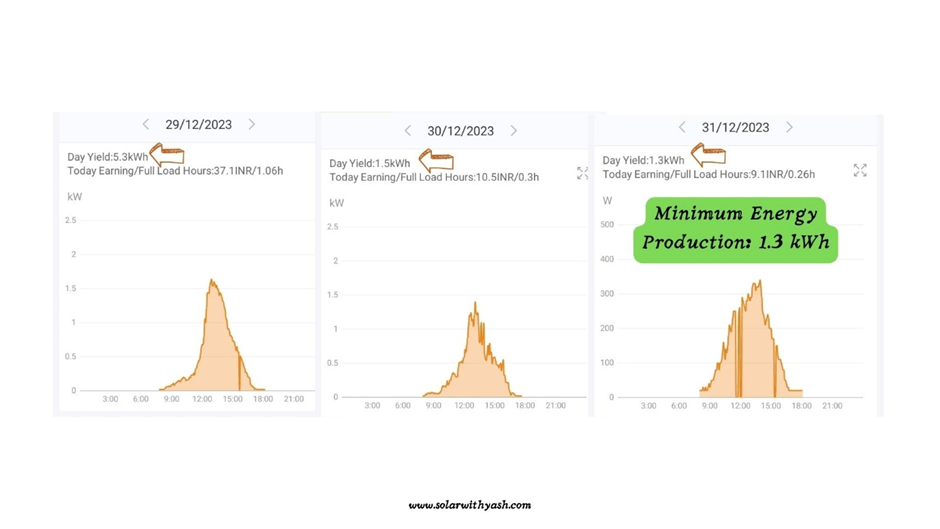
Let us see the day-wise performance of our 5-kW grid-tied solar power system.
First, how to study the graphs?
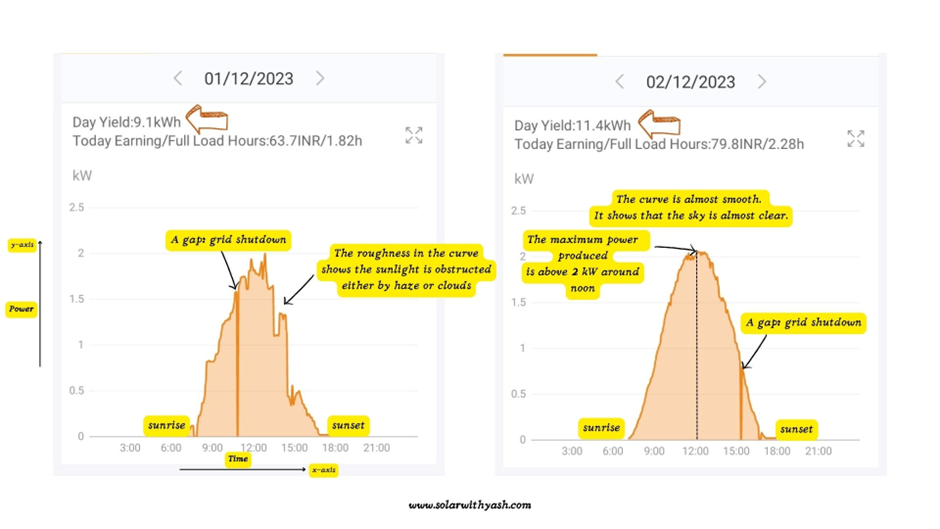
The x-axis is the time and the y-axis represents the power produced by the solar panels.
The product of the time on the x-axis at any moment with the power produced gives us the energy produced by the solar panels in that time moment.
The gap in the graphs represents the grid supply being shut down.
The smoothness shows the sunlight is consistent and uniform.
The roughness in the curve shows that the sunlight is obstructed either by clouds, fog, or haze in the air.
The curve starts with the sunrise and it starts rising and reaches the maximum value around noon. Thereafter, it gradually reduces and reaches the minimum value during the sunset.
Total and the average energy by 5 kW solar
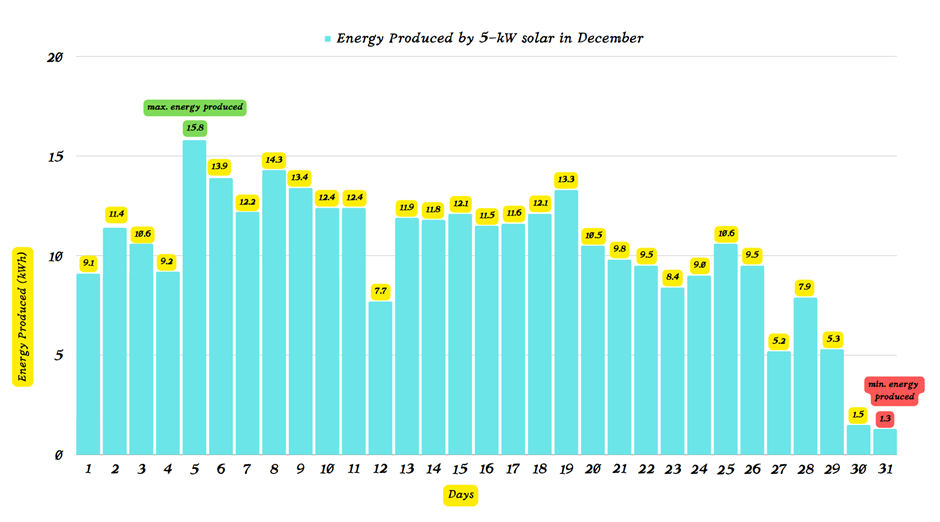
When I added energy produced in all 31 days it was 315.2 kWh.
Comparing it with the previous months:
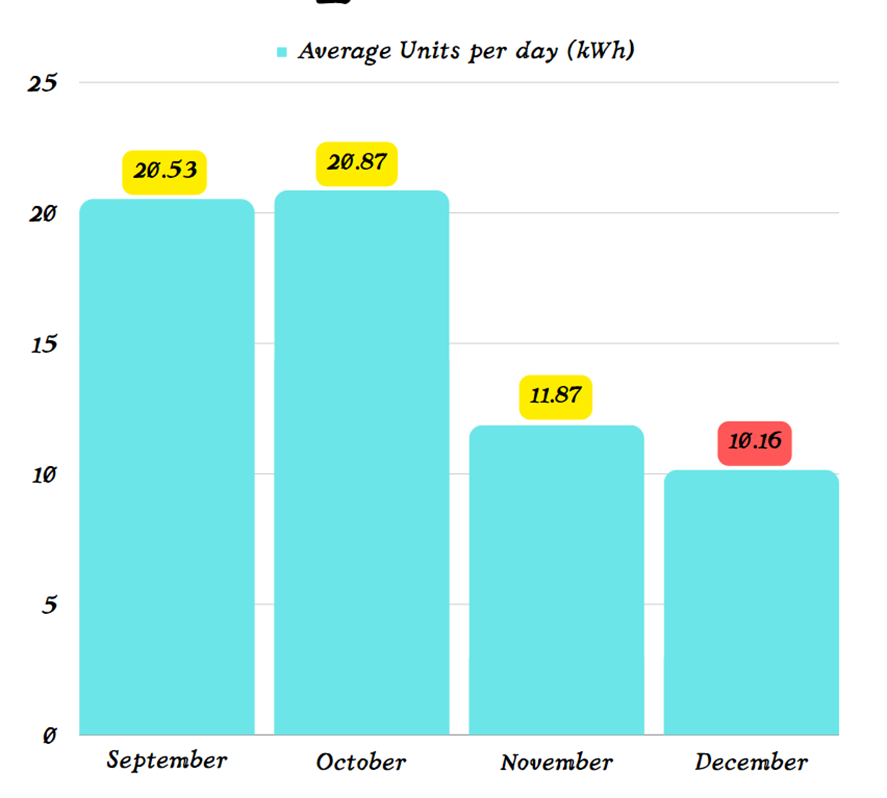
- September: 616 kWh; Average: 20.53 kWh
- October: 647 kWh; Average: 20.87 kWh
- November: 356 kWh; Average: 11.87 kWh
- December: 315.2 kWh Average: 10.16 kWh (It was 17% less than the previous month)
Money saved by 5-kW solar in December
The money saved can be found by multiplying units produced by the unit grid rate.
The grid electricity price in our region is Rs. 7 per unit.
Our 5-kW solar generated 315.2 kWh in December.
Therefore, the money saved is:
315 x Rs. 7 = Rs. 2205.
Let us see how it performed in the previous 3 months.
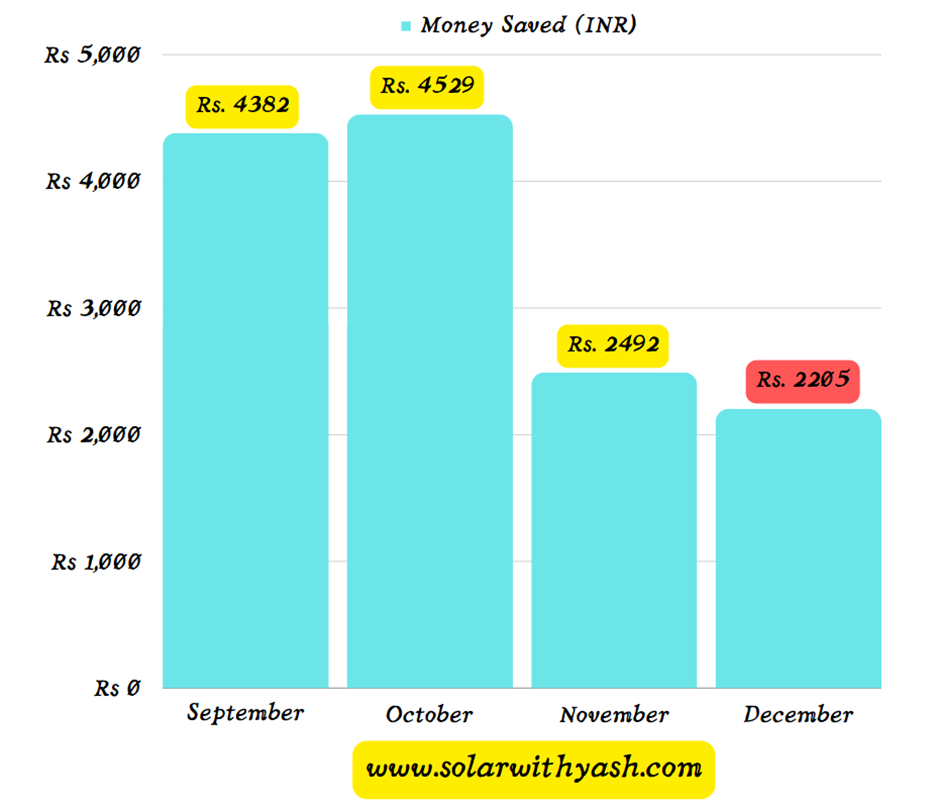
It was almost half what it produced in September (Rs. 4382) and October (Rs. 4529).
Reason behind this low performance
December month in North India is cold and fog in the air.
There were clouds in the sky.
The wind speed is also slow.
All this creates a hurdle in the sunlight reaching the solar panels.
The sunlight is reflected and deviated from its path and the solar panels receive less solar energy falling on their surfaces.
Hence, they produce less electricity for running the electrical appliances.
Yes, the solar panels’ performance is impacted in December.
They were not working to their full potential. Their output was 40% – 50% of what we can expect on a clear sunny day.