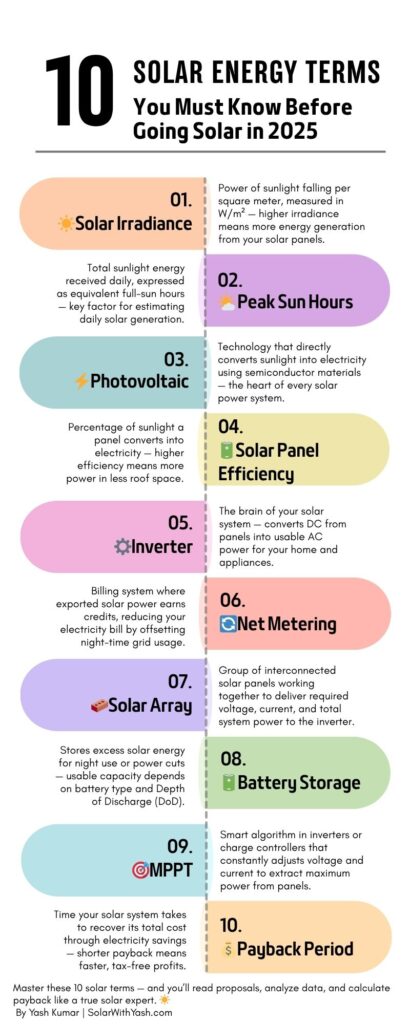
10 Solar Terms You Must Know Before Going Solar in 2026
When I first heard about rooftop solar back in 2010, I was fascinated — the idea of generating electricity from sunlight sounded futuristic and full of promise.
But as I started learning more, I quickly ran into terms like solar irradiance, PSH, MPPT, net metering, and payback period. Honestly, it was overwhelming. These technical words kept popping up everywhere — in YouTube videos, brochures, datasheets, and installer proposals — and at that time, they only confused me more.
Over the years, as I studied solar engineering books and worked on hundreds of real rooftop projects, I realized that these terms are actually quite simple once you understand their meaning and role in the solar power system.
So, to save you from that same confusion I faced, I’ve created this guide —
“10 Solar Terms You Must Know Before Going Solar in 2025.”
These are the most commonly asked or talked-about terms in solar energy, especially for home solar (grid-tied) systems.
By the end of this post, you’ll not only recognize these words but also understand how they impact your solar design, performance, and savings — making you confident to move ahead in your solar journey.
Let’s get started!
1. Solar Irradiance
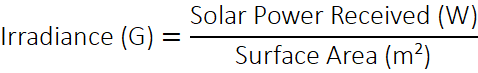
Definition: Solar irradiance is the power of sunlight falling per unit area on a surface, measured in watts per square meter (W/m²). In simple terms, it tells us how intense the sunlight is at a particular moment.
Formula:
Typical Values:
- Bright sunny noon → ≈ 1000 W/m² (Standard Test Condition)
- Slightly cloudy → 400 – 600 W/m²
- Overcast or evening → 100 – 300 W/m²
In Solar PV Systems:
Irradiance directly controls how much power your panels generate. When irradiance doubles, your DC power output roughly doubles as well. Every feasibility study or performance simulation begins with accurate irradiance data, usually taken from NREL, MNRE, or PVGIS sources.
Across India, the average daily solar irradiance ranges from 4 to 6 kWh/m²/day, depending on the region — the highest in Rajasthan and the lowest in Kerala or Assam.
Real-Life Example (My 5 kW System):
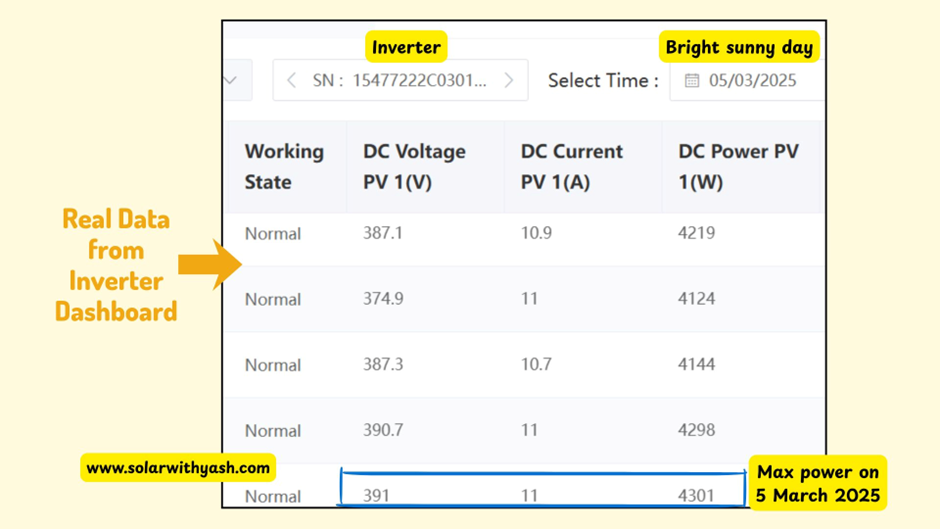
On bright days, my 5kW grid-tied system consistently produces 4.3–5.1 kW around noon. But when thick clouds come in between the sun and my solar panels, I’ve seen the power dip to just 1.3–1.8 kW — almost 65-70% drop.
Let me share with you, data of two different dates – 5 March 2025 (clear day) and 5 August 2025 (cloudy day)
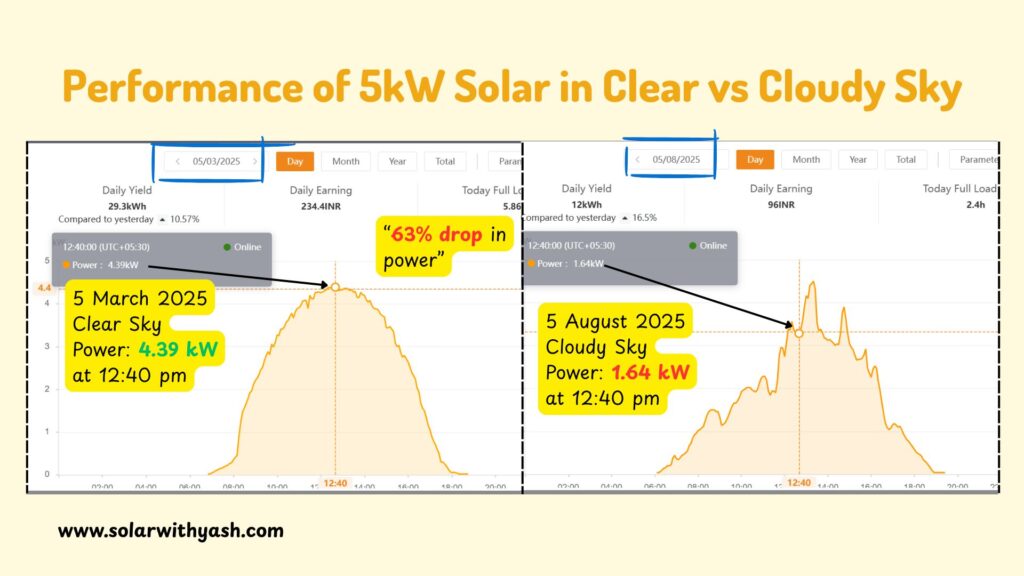
You can clearly see these differences: smooth and high peak on a sunny day (5 March 2025 and a low and rough power output on a cloudy day (5 Aug 2025).
Insight:
Even a 10% drop in average irradiance can reduce annual energy yield by the same percentage. That’s why correct tilt, orientation, and shading analysis are critical during system design.
2. Peak Sun Hours
Definition: Peak Sun Hours (PSH) represent the number of hours per day when the solar irradiance averages 1000 W/m², which is the standard test condition used to rate solar panels.
It doesn’t mean the sun shines for only 5 hours — rather, it’s the total sunlight energy received throughout the day, expressed as if the sun shone at full intensity for that many hours.
Formula:
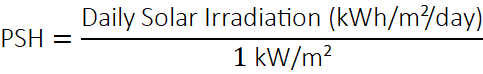
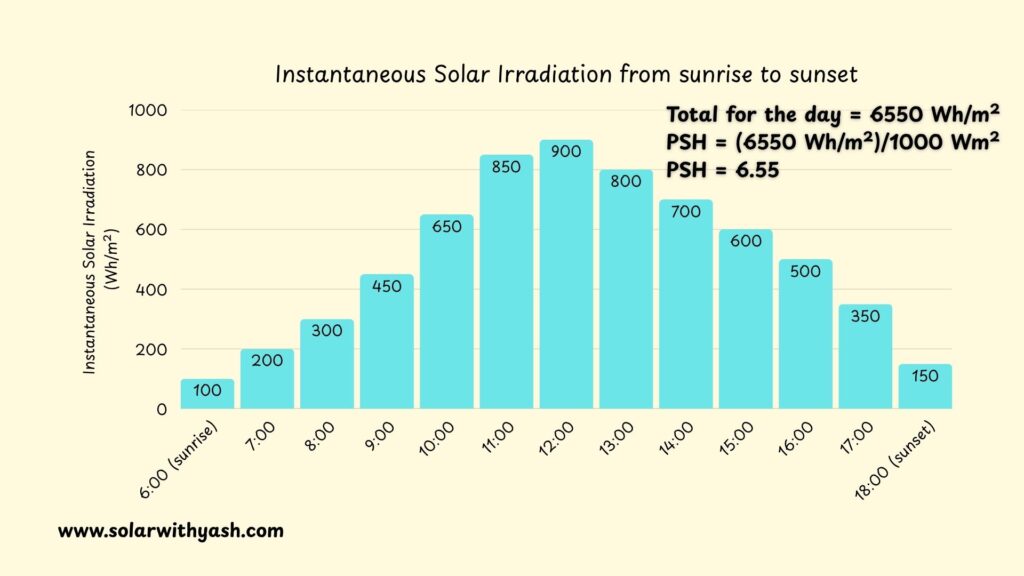
You can easily get the PSH value from the chart by adding all the instantaneous solar irradiation from sunrise to sunset and dividing the sum by 1000.
PSH = (100+200+300+450+650+850+900+800+700+600+500+350+150)/1000
Peak Sun Hours = 6550/1000 = 6.55
Typical Values Across India:
- Rajasthan / Gujarat → 5.5 – 6.0 PSH/day
- Maharashtra / MP → 5.0 – 5.5 PSH/day
- Uttar Pradesh / Delhi NCR → 4.8 – 5.2 PSH/day
- Kerala / Assam → 4.0 – 4.5 PSH/day
In Solar PV Systems:
PSH is one of the most important parameters for system sizing. It determines how much energy your solar panels can generate each day:

Example:
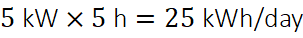
If your system is 5 kW and your region receives 5 PSH, your daily generation will be approximately:
Real-Life Example (from my 5kW system)
At my home in Ghaziabad, Uttar Pradesh, the average annual Peak Sun Hours (PSH) is around 5.35 hours. On a clear sunny day (4 May 2025), my inverter recorded 26.3 kWh of generation — almost identical to the theoretical estimate of 26.75 kWh (5.35 × 5 kW).
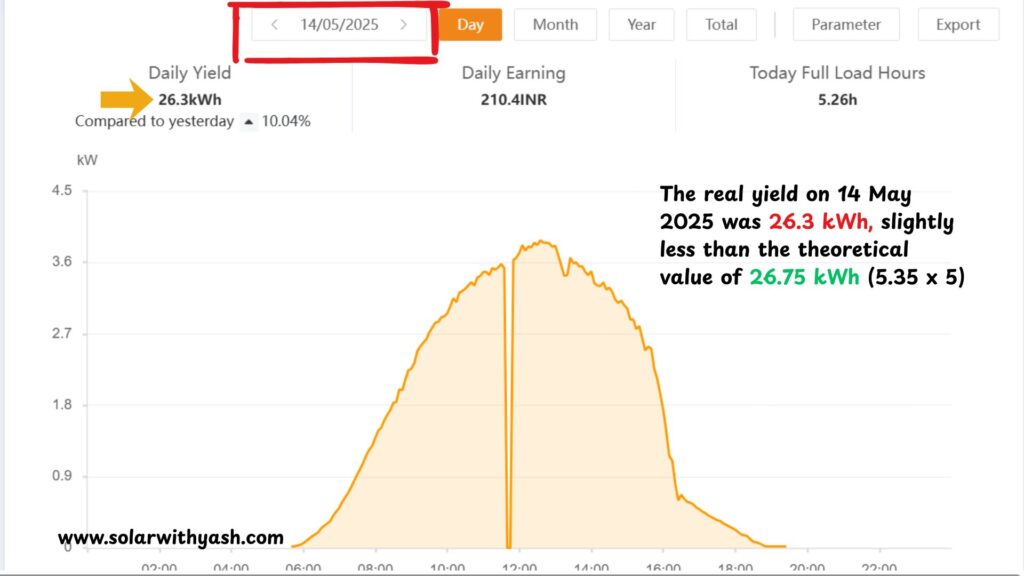
The small difference is completely normal and comes from minor system losses such as inverter efficiency, cable resistance, and temperature effects. In short, it’s a great real-world validation of how PSH directly translates into daily solar generation.
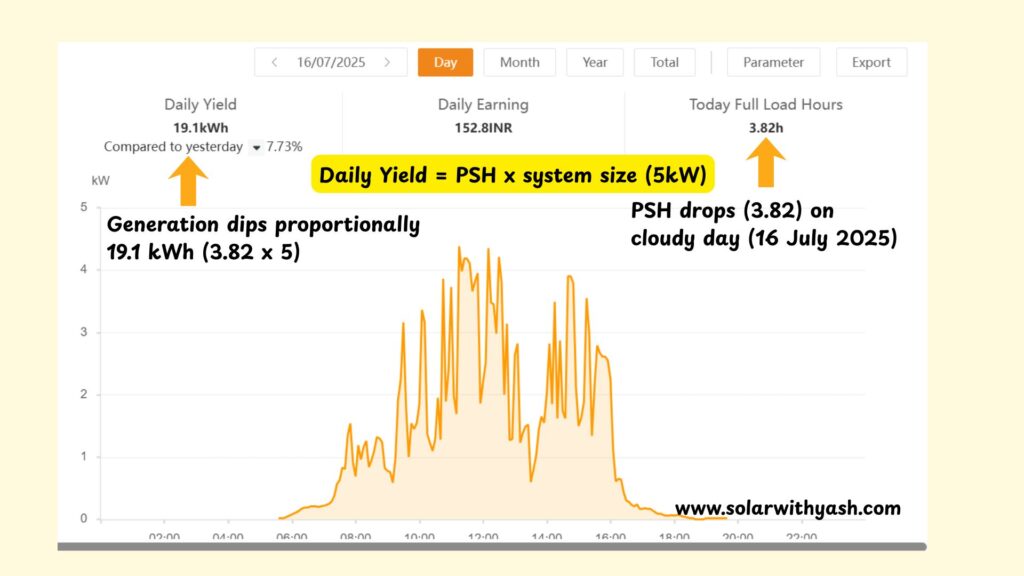
However, during winter haze or cloudy monsoon weeks, PSH drops to about 3.5–4 hours, and the generation dips proportionally to 17–19 kWh/day.
Insight:
Knowing your local PSH is the foundation for solar ROI, feasibility, and system design. It directly affects your payback period and expected savings.
💡 (You can use my free “Solar Snap Tool” to instantly check PSH for your city.)
3. Photovoltaic (PV)
Definition: The word Photovoltaic (PV) comes from two roots — “photo” meaning light and “voltaic” meaning electricity.
So, Photovoltaic simply means “converting light into electricity.”
A solar photovoltaic system uses semiconductor materials (like silicon) to convert sunlight directly into DC electricity through the photovoltaic effect — a
process discovered in 1839 by French scientist Edmond Becquerel and practically
implemented in solar cells in the mid-20th century.
How It Works:
When sunlight — made up of countless tiny photons — falls on a solar cell, something fascinating happens inside the silicon layer. These photons carry energy, and when that energy is greater than the band gap of silicon (about 1.1 electron volts, or eV), the electrons in the silicon atoms get excited enough to jump from the valence band to the conduction band.
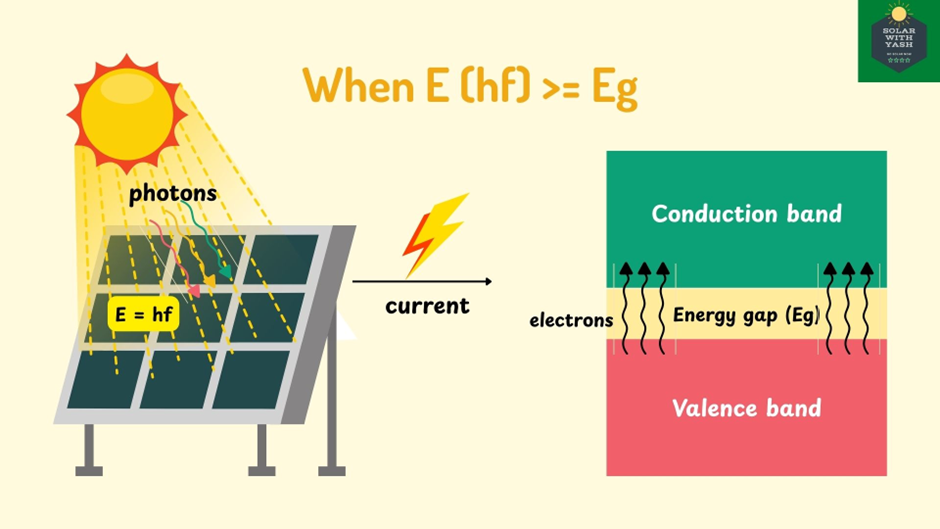
Think of it like giving a small push to a resting electron — once it crosses that energy barrier, it’s free to move. These freed electrons start flowing through the circuit, creating an electric current that we can capture and use.
Each solar cell produces roughly 0.5–0.6 volts, and when many of these cells are connected in series, they form a solar module (panel) capable of generating hundreds of watts of clean DC power.
It’s almost magical to realize that every time sunlight hits your rooftop, trillions of electrons inside silicon are jumping that tiny 1.1 eV energy barrier — silently turning sunlight into usable electricity.
Formula (Simplified Concept):

The higher the sunlight (irradiance) and the cleaner the panel, the greater the voltage and current generated.
Structure of a Modern PV Cell (with TOPCon Example)
While the working principle of all solar cells remains the same — converting sunlight into electricity — the cell structure and technology have evolved dramatically over time. Earlier cells used simple P-type silicon, but today’s high-efficiency modules often use N-type TOPCon (Tunnel Oxide Passivated Contact) technology, like the one shown in the diagram below.
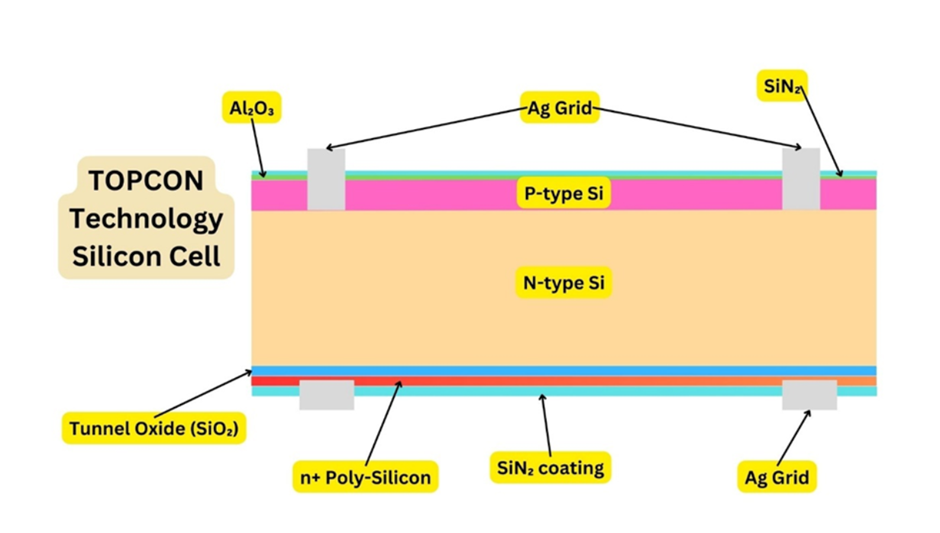
In this structure:
- Front Layer (Anti-reflective & Passivation Coating): A thin SiN₂ or Al₂O₃ layer minimizes light reflection and protects the surface.
- P-type & N-type Silicon Layers: These form the p–n junction, creating an internal electric field that separates electrons and holes when sunlight hits the cell.
- Tunnel Oxide (SiO₂) + n⁺ Poly-silicon Layer: This is what makes TOPCon special — the ultra-thin tunnel oxide layer allows electrons to pass through easily while reducing recombination losses, improving efficiency beyond 23–24%.
- Ag Grid (Front & Rear Contacts): Fine silver lines collect and transport the current generated in the cell.
- Backsheet / SiN₂ Coating: Protects the cell from dust, moisture, and mechanical stress.
In simple terms, this structure ensures that every photon absorbed in the silicon has a higher chance of freeing an electron and sending it to your inverter as usable energy. It’s a beautiful blend of materials science and solar innovation that makes modern panels so efficient.
Typical Panel Specs:
A standard 550 W monocrystalline panel contains about 144 half-cut cells.
Efficiency ranges between 19–22% depending on the technology (Mono PERC, TOPCon, or HJT).
Real-Life Example (My 5 kW System):
My rooftop system in Ghaziabad uses 10 panels of 525 W each, totaling around 5.25 kW.
On bright sunny days, the DC side voltage from my array is around 380–390 V, with current up to 11 amperes — data you can easily view from the inverter dashboard.
4. Solar Panel Efficiency
Definition: Solar panel efficiency is the percentage of sunlight that a solar panel can convert into usable electrical energy.
It tells you how effectively your panel turns solar irradiance (sunlight) into electric power.
Simply put — if 1000 W/m² of sunlight falls on your panel, and it produces 200 W of electrical power, its efficiency is 20%.
Formula:

Typical Efficiency Values:
| Technology | Efficiency Range | Notes |
|---|---|---|
| Polycrystalline | 15 – 17 % | Older, lower-cost technology |
| Mono PERC | 19 – 21 % | Most common in Indian homes |
| TOPCon / HJT | 21 – 23 % | Premium, high-performance panels |
| Bifacial (front + rear) | Up to 25 % effective | Depends on the reflectivity of the roof |
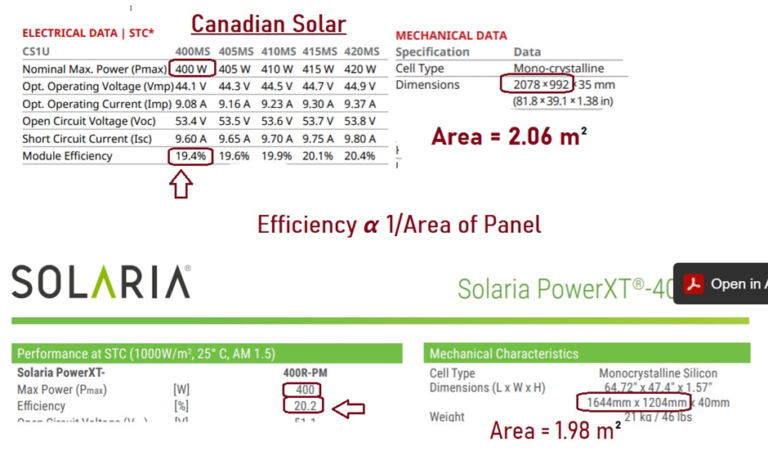
Why Efficiency Matters in Solar PV Systems:
Higher efficiency means more power in less space — critical when the roof area is limited.
For example, a 20% efficient 1 m² panel produces 200 W, while a 15% efficient panel produces only 150 W under the same sunlight.
That’s a 25–30% gain in output just by using better technology.
Real-Life Example (My 5 kW System):
My rooftop system in Ghaziabad utilizes 530 W monocrystalline PERC panels with an efficiency of ~20.5%.
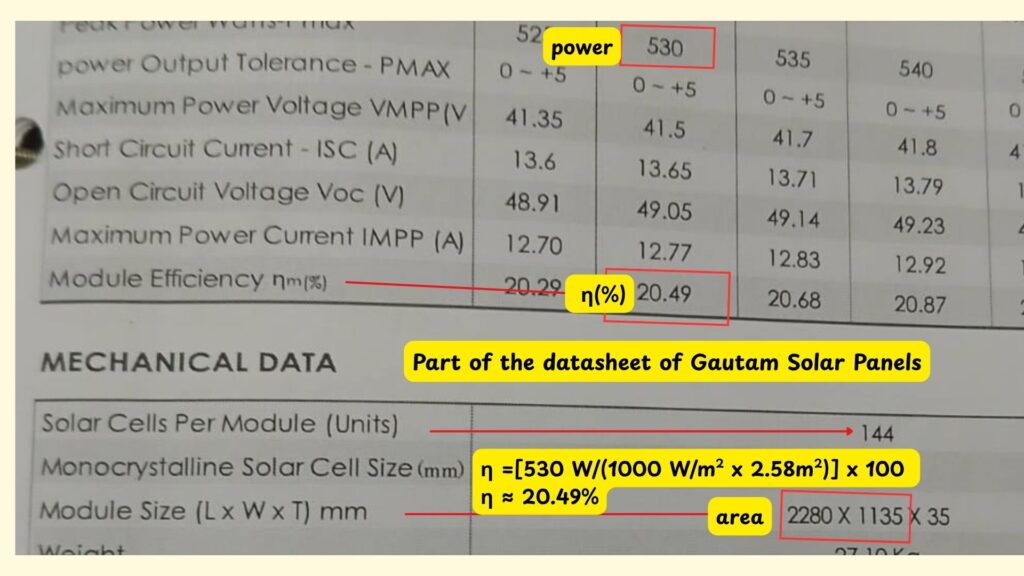
Each panel occupies approximately 2.58 m² (2.280 m x 1.135m), so the efficiency would be: (530 Watts/1000 x 2.58) x 100 = 20.5%
This shows how you can find the panel efficiency directly from its power and cross-sectional area.
Insight
Efficiency isn’t just a number — it affects your energy yield, roof space, and long-term ROI.
In urban areas with smaller rooftops, going for high-efficiency panels (≥20%) ensures maximum generation and faster payback.
💡 Tip: Always compare the efficiency-to-price ratio, not just panel wattage, when selecting modules.
5. Inverter
An inverter is the heart of every solar PV system.
It converts the DC electricity (produced by solar panels) into AC electricity, which can be used to power household appliances or fed into the grid.
Without an inverter, your solar panels can’t directly power your home — because most appliances run on a 230V AC supply.
Working Principle:
When sunlight strikes the panels, DC is generated. The inverter takes this DC voltage and converts it to AC using a process called pulse-width modulation (PWM) or sine wave conversion, which matches the grid frequency (50 Hz in India).
Formula:

Types of Inverters:
| Type | Description | Common Use |
|---|---|---|
| String Inverter | Connects multiple panels in series. | Most rooftop systems (3–10 kW) |
| Microinverter | One inverter per panel. | Shaded or complex roofs |
| Hybrid Inverter | Works with battery + grid. | Backup + solar combo setups |
| Central Inverter | Large-scale systems (>100 kW). | Solar farms |
Typical Efficiency:
Modern inverters are 95–98% efficient.
That means if your panels generate 5000 W DC, the inverter output will be about 4800–4900 W AC.
Real-Life Example (My 5 kW System):
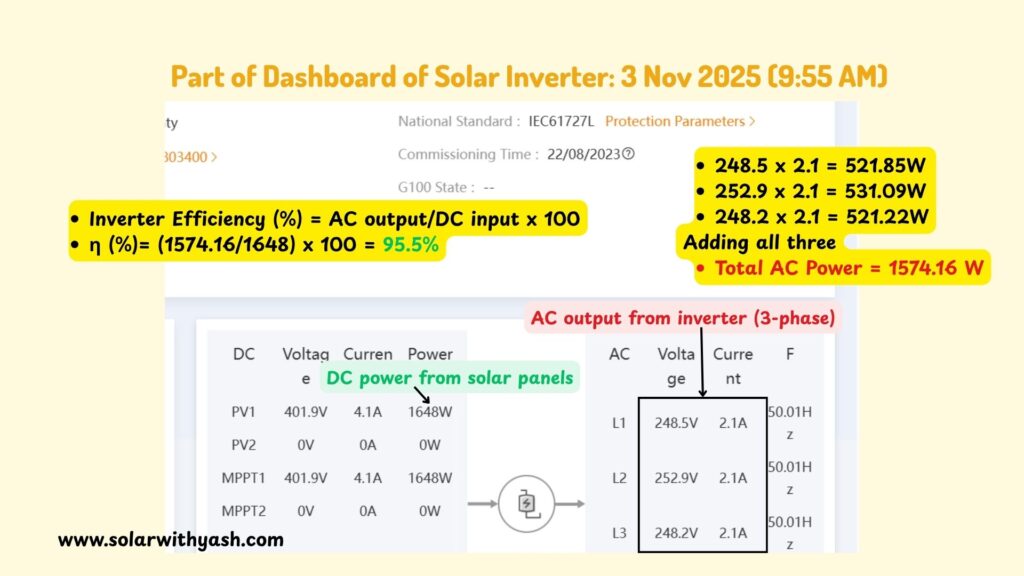
As seen in the inverter dashboard snapshot below (3 Nov 2025, 9:55 AM), my inverter recorded 1648 W DC input and 1574 W AC output — resulting in an efficiency of about 95.5%, which aligns perfectly with real-world conditions. This live data helps me continuously monitor inverter performance, verify conversion efficiency, and quickly detect issues like string disconnection, shading, or wiring losses.
Insight:
A high-quality inverter not only ensures maximum power conversion but also improves system reliability and data visibility through online monitoring.
💡 Tip: Always match inverter capacity to 90–110% of your panel capacity and check for MPPT trackers, which optimize energy harvest under variable sunlight.
6. Net-Metering
Net metering is a billing mechanism that allows solar energy users to export excess electricity generated by their system to the grid and earn credits for it.
At the end of the billing cycle, you’re charged only for your “net” electricity consumption — that is, the difference between the electricity you used from the grid and what your solar system sent back.
How It Works:
Your electricity meter is replaced by a bi-directional meter that can record both import (from grid) and export (to grid) readings.

- If the value is positive, you pay for that much electricity.
- If negative, the surplus becomes a credit in your next bill.
Example (for a 5 kW Grid-Tied System in Ghaziabad):
- Solar generation: 720 units/month
- Home consumption: 600 units/month
- Exported to grid: 250 units
- Imported from grid (night-time use): 130 units
Net units = 130 (import) – 250 (export) = –120 units
➡️ You’ll get credit for 120 units, carried forward to the next billing cycle.
This means your daytime surplus offsets your nighttime usage — significantly reducing or even eliminating your monthly electricity bill.
Benefits of Net-Metering
- Reduces your electricity cost drastically
- Maximizes ROI on solar investment
- Makes solar feasible without batteries
- Encourages efficient energy use
Typical Policy in India:
- Allowed for systems up to 500 kW (varies by state)
- Settled monthly or annually, depending on the DISCOM
- Credit rates generally equal to retail tariff (₹6–₹8/unit)
Real-Life Insight (My 5 kW System):
In Ghaziabad, my system exports more than it imports for nearly 8 months a year. My average monthly bill has dropped from ₹6,000 to under ₹ 1,000, mostly due to fixed charges. During the sunny summer months, I even carry forward extra credits to use during the monsoon season.
Pro Tip:
Always confirm your state’s net metering cap and settlement policy before installation. It directly affects your financial feasibility and payback period.
7. Solar Array
Definition: A solar array is a group of multiple solar panels connected to form a larger power-generating unit.
When you install a rooftop system, you’re not placing just one panel — you’re connecting several panels in series and/or parallel to achieve the required voltage, current, and total power.
This connected network of panels is called the solar array.
Basic Concept:
Each solar module produces DC voltage and current.
- Connecting panels in series increases voltage (V).
- Connecting panels in parallel increases current (A).
So, depending on the inverter voltage range and string design, panels are grouped in specific combinations.
Example Formula:

Typical Residential Array Example:
Let’s say each 540 W panel gives around 40 V and 13.5 A.
If you connect 10 panels in series (like in my 5kW system):


This DC output is then fed to the inverter, which converts it into AC power for home use.
Real-Life Example (My 5 kW System):
My Ghaziabad rooftop system consists of 10 × 530 W Mono PERC panels arranged in one DC string — forming a single 5.3 kW array.
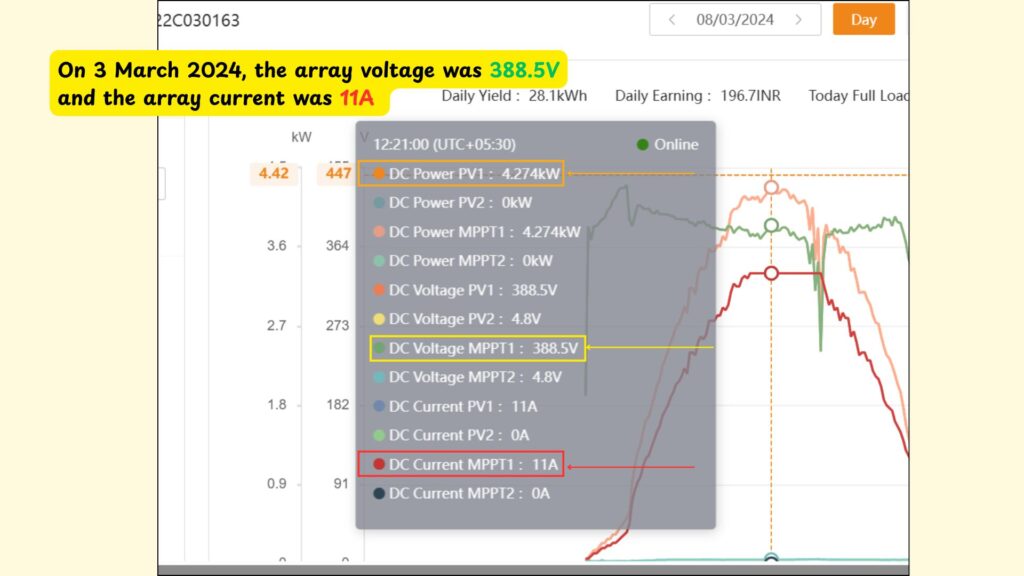
On 3 March 2024, my inverter dashboard showed that the solar array was operating at a voltage of 388.5 V and a current of 11 A, delivering about 4.27 kW DC power from MPPT1. The second MPPT remained inactive (0 V, 0 A), confirming that only one PV string was active and efficiently generating power under clear-sky conditions.
Why Array Design Matters:
- Determines voltage window compatibility with inverter MPPTs.
- Affects shading tolerance and overall system yield.
- Impacts cable sizing, safety, and energy losses.
Pro Tip:
Always design arrays so that your maximum voltage at the coldest temperature and minimum voltage at the hottest temperature stay within the inverter’s DC limits.
Proper array configuration ensures safe, efficient, and long-lasting performance
8. Battery Storage
Definition: Battery storage in a solar PV system allows you to store excess electricity generated during the day and use it later — typically at night or during power cuts.
It acts as your personal energy bank, ensuring uninterrupted power and better self-consumption of solar energy.
How It Works:
During the day, your panels generate more power than your home may use. The surplus DC electricity is diverted to charge the batteries through a charge controller or hybrid inverter.
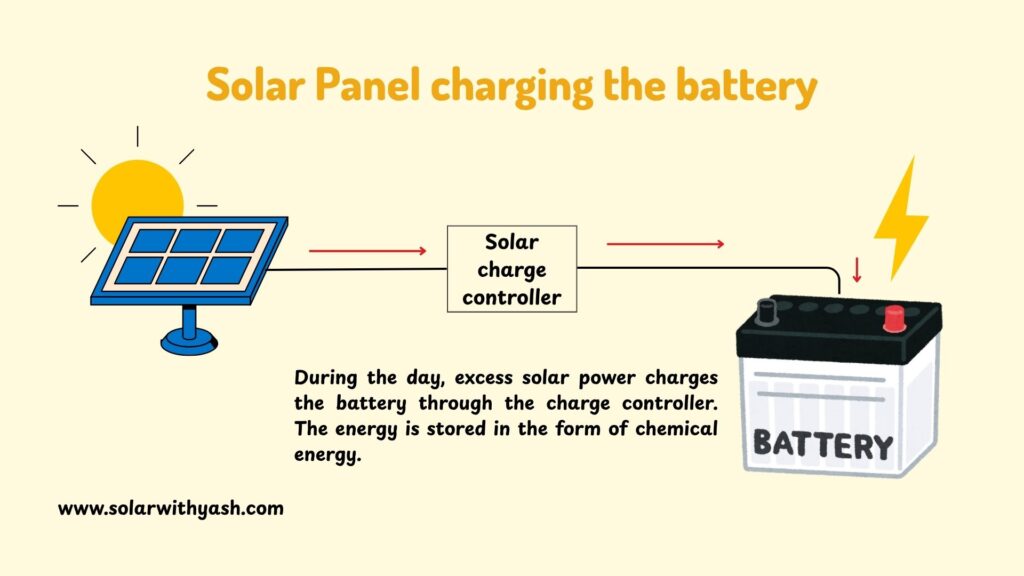
At night or during cloudy hours, this stored energy is released back to run your household loads — but remember, you can’t use the full battery capacity, because every battery has a Depth of Discharge (DoD) limit that defines how much of its stored energy can be safely utilized without reducing lifespan.
Formula (with DoD included)

Example
A 48V, 150Ah lithium-ion battery with 90% DoD can store:

A lead-acid battery of the same rating (with ~60% DoD) would give only 4.32 kWh usable, showing why lithium batteries deliver more usable energy per cycle.
Types of Batteries Used in Solar Systems
| Type | Lifespan | Depth of Discharge (DoD) | Notes |
|---|---|---|---|
| Lead-Acid (Tubular) | 4–5 years | 50–60% | Budget option needs maintenance |
| Lithium-ion (LiFePO₄) | 10–12 years | 80–90% | Higher cost, low maintenance |
| Gel/AGM | 5–7 years | 60–70% | Sealed, safer, less efficient |
Battery Sizing Example (My System Perspective):
Although my Ghaziabad rooftop system is grid-tied and doesn’t include batteries, I’ve tested setups using 5 kWh lithium batteries for demonstration.
During a power cut, such a system can easily run fans, lights, Wi-Fi, and TV for about 5–6 hours — ensuring backup without relying on diesel generators.
If paired with solar, the battery recharges daily, making it ideal for areas with frequent outages.
Why Battery Storage Matters:
- Provides night-time and backup power.
- Increases self-consumption in zero-export or off-grid setups.
- Ensures energy security during grid failures.
However, batteries add significant cost, so they make sense only when:
- You have frequent power cuts, or
- Net metering isn’t available, or
- You aim for complete energy independence.
Pro Tip:
If you plan to add batteries later, install a hybrid inverter now. It allows easy battery integration in the future without major rewiring.
9. MPPT (Maximum Power Point Tracking)
MPPT (Maximum Power Point Tracking) is an advanced electronic algorithm used in inverters or charge controllers to extract the maximum possible power from a solar array under changing sunlight and temperature conditions.
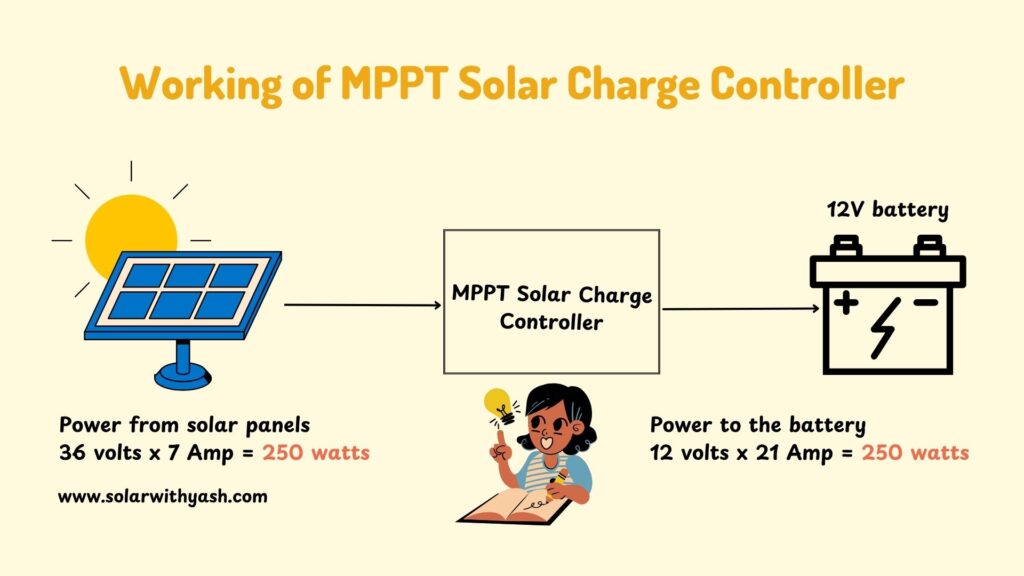
This simple diagram shows how an MPPT solar charge controller smartly converts 36 V × 7 A (250 W) from solar panels into 12 V × 21 A (250 W) for the battery — keeping the power same but optimizing voltage and current to ensure faster, efficient charging without energy loss.
In simple terms, the MPPT ensures your panels are always working at their sweet spot — the point where voltage × current = maximum power output.
Why It’s Needed:
The voltage and current of a solar panel vary constantly with irradiance, temperature, and shading.
If the inverter always operated at a fixed voltage, it would often miss this sweet spot.
MPPT technology dynamically adjusts the operating voltage of the array to continuously track and stay at that maximum power point.
Formula:
MPPT continuously adjusts the inverter’s input voltage (V) to maintain the product (P) at its highest possible value.
Typical Performance Gain:
Compared to systems without MPPT, those with it can generate 15–25% more energy, especially under cloudy or partially shaded conditions.
How It Works (Conceptually):
The inverter continuously monitors the DC voltage and current from the solar panels. It identifies the point at which the product of voltage and current — that is, the power — is maximum, and automatically adjusts the operating point to maintain that voltage.
This process repeats every few milliseconds — effectively “chasing” the sun’s best output conditions throughout the day.
Real Life Example (My 5kW System)
My inverter in Ghaziabad has 2 MPPT trackers.
All 10 panels (one string) are connected to a single MPPT input.
On clear mornings, MPPT locks around 410–420 V, delivering maximum power.
But during partial shading or passing clouds, I can see the MPPT voltage fluctuate dynamically in the dashboard — optimizing every few seconds to keep power output steady.
This fine-tuning is why my inverter maintains ~96% efficiency even on variable days.
Insight:
MPPT is like a smart gear system for your inverter — always shifting to get the best performance from your panels.
Pro Tips:
- Prefer inverters with multiple MPPTs if your roof has different tilt angles or partial shading.
- Avoid mixing panels of unequal ratings on the same MPPT channel.
- Clean panels regularly — even MPPT can’t fix power loss from dirt and shadows.
10. Payback Period
Definition: The payback period is the time it takes for your solar investment to recover its total cost through electricity savings.
In simpler terms, it tells you how long before your solar system starts giving you pure profit.
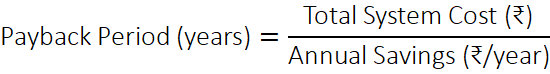
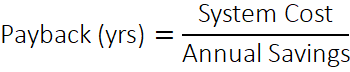
Formula:
Typical Payback Period in India:
| System Type | Approx. Payback | Notes |
|---|---|---|
| Residential (with subsidy) | 3.5 – 5.5 years | Depends on the state and tariff |
| Residential (no subsidy) | 5 – 6.5 years | Metro cities, higher tariffs = faster recovery |
| Commercial | 3 – 4 years | Due to higher daytime consumption |
Example (My 5 kW Rooftop System Payback in Ghaziabad, Uttar Pradesh):
- System Cost (after subsidy): ₹2,40,000
- Average Monthly Generation: 600 units
- Average Grid Tariff: ₹8.0 per unit
- Annual Savings: 600 × 12 × ₹8 = ₹57600/year

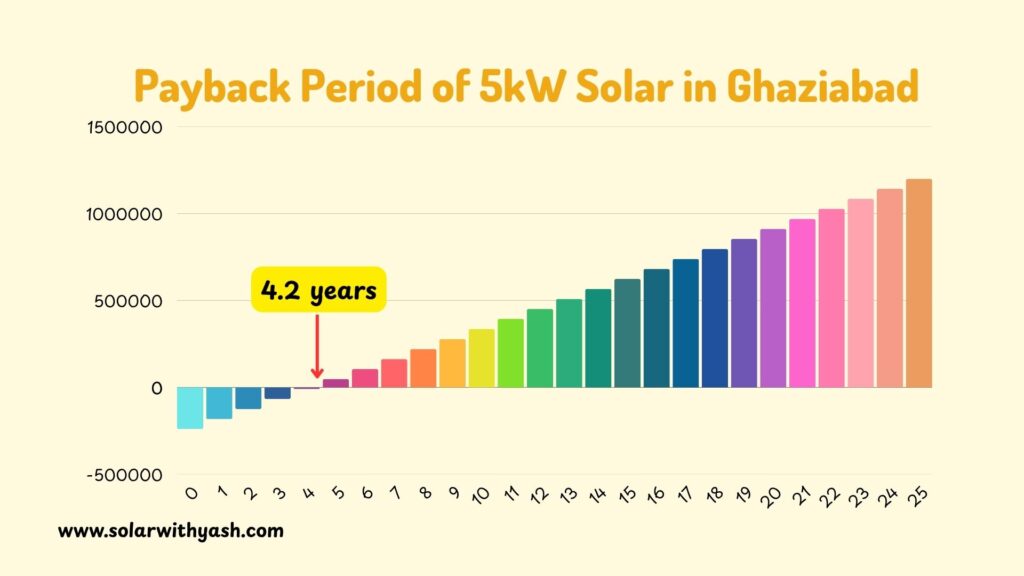
So, in less than 4.2 years, the system pays for itself — and for the next 20+ years, it continues to generate free electricity worth over ₹11–12 lakh (at current tariffs).
Factors Affecting Payback:
- Peak Sun Hours (PSH): More sunlight = faster recovery.
- Tariff Rate: Higher electricity cost = higher savings.
- Subsidy: Reduces upfront investment.
- Maintenance: Clean panels, no downtime = steady performance.
- Net Metering Policy: Determines how much you earn for exported power.
Real-Life Insight:
I often track my inverter data and bills side by side. Every month that I save ₹5,000–₹6,000, I remind myself: this system is literally paying me back.
Even accounting for a 1% annual degradation, my lifetime ROI remains over 400%, which is far better than fixed deposits or mutual funds — and it’s tax-free!
Pro Tip:
Always calculate payback and ROI before installation.
If your system’s payback exceeds 7 years, it’s worth reviewing your component selection, subsidy eligibility, or tilt/orientation setup.
For accurate calculations, use my Solar Feasibility Spreadsheet (SFS) — it automatically estimates generation, savings, and ROI for your city.
10. Conclusion: Understanding Solar Terms = Confident Solar Decisions
When I started exploring solar back in 2010, these technical terms — irradiance, PSH, MPPT, efficiency — used to confuse me. But once I understood what each one meant and how it affected system performance, solar energy became much simpler and far more exciting.
Now that you’ve gone through all 10 essential solar terms, you can confidently read solar proposals, analyze inverter data, or even size your own system.
Remember — solar is not complicated, it’s just a beautiful mix of science and smart design.
Every homeowner and student should know these fundamentals before investing or designing a system. Whether it’s understanding your irradiance and PSH, choosing the right inverter and panels, or estimating your payback period — these concepts form the foundation of every solar project.
If you’d like to take your understanding further:
- 🔍 Use my free [Solar Snap Tool] to find sunlight intensity and PSH for your city.
- 📊 Try the [Solar Feasibility Spreadsheet (SFS)] to instantly calculate ROI, payback, and energy yield for your home.
- 🎓 Or dive deep into my Solar Energy Masterclass: Basics to Profit, where I teach everything from fundamentals to complete financial feasibility — with examples, Excel tools, and lifetime updates.
Because the more you understand solar, the more confidently you can harness it.
And that confidence is the real start of your solar journey. ☀️
FAQ: Solar Energy Terms Before Going Solar
Q1. What is the most important parameter to check before installing a solar system?
Always start with Peak Sun Hours (PSH) for your city. It determines how much energy your panels can produce daily. You can find your PSH easily using my Solar Snap Tool.
Q2. How can I estimate the size of the solar system I need for my home?
Divide your monthly electricity consumption (kWh) by 30 × PSH × system efficiency (≈0.8).
Example: 600 kWh/month → 600 ÷ (30×5×0.8) ≈ 5 kW system.
Q3. Does panel efficiency really affect savings?
Yes. A 21% efficient panel can generate about 30% more energy than a 16% panel in the same area — leading to faster payback.
Q4. How long do solar panels last, and how does degradation affect ROI?
Most panels last 25 years+ with ~0.5% yearly degradation. After 25 years, you still get about 85% of the original output, which keeps your ROI strong for decades.
Q5. How do I calculate the payback period for my own system?
Use this formula:
Or get my free Solar Feasibility Spreadsheet (SFS) — it automates generation, payback, and ROI.