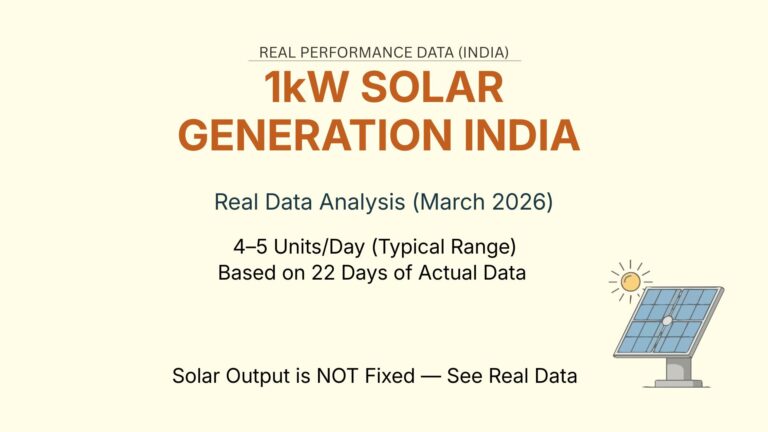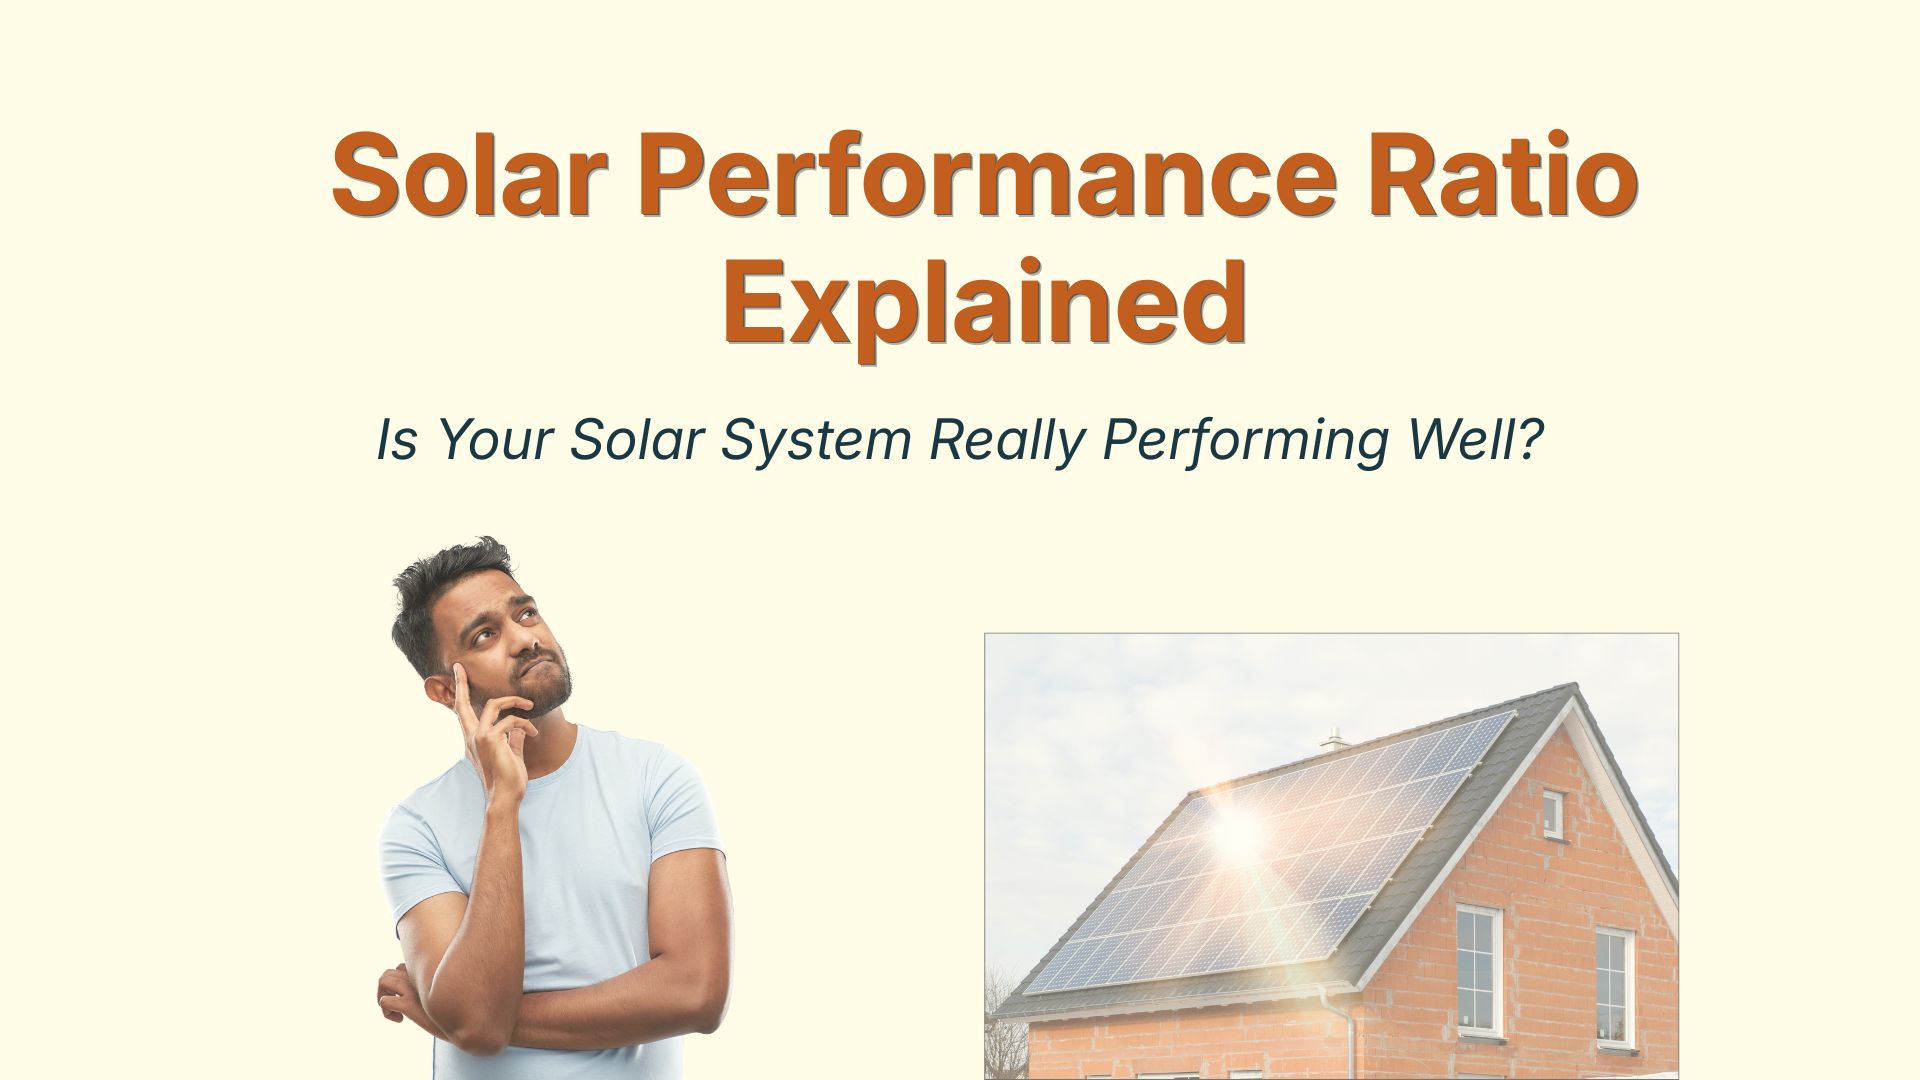
Solar Performance Ratio Explained: Real Data from My 5.25 kW System
The day our solar system was installed in August 2023, I kept checking one thing again and again: “How many units is it generating today?”
Every evening, I would open the app, look at the numbers, and feel satisfied seeing the energy production.
At that time, I believed one simple thing:
More units = better system performance.
Our system was called a 5kW setup (though the actual installed capacity is 5.25 kW—a detail I didn’t pay attention to initially).
But after a few months, I noticed something interesting.
A nearby system—slightly larger than mine—was generating almost the same number of units as my system on certain days.
That got me thinking…
If both systems are producing similar energy, is the bigger system really performing better?
Or is my smaller system actually doing a better job?
That’s when I came across a concept called Performance Ratio (PR).
And honestly, it changed the way I look at solar systems. Because it’s not just about how much electricity you generate, it’s about how efficiently your system converts sunlight into energy.
In this post, we’ll break down Performance Ratio in simple terms and see how this one number can reveal the true performance of your solar power system.
What is Performance Ratio
Performance Ratio (PR) is simply the ratio of actual electricity generated by your solar system to the electricity it could generate under ideal conditions.
Formula:
Performance Ratio (PR) = Actual Energy Produced (kWh) ÷ Expected Energy Production (kWh)
Since it is a ratio, it has no unit (dimensionless). The maximum value of PR is 1, which represents an ideal system. (In real life, PR is always less than 1)
What Does Performance Ratio Indicate?
- PR > 0.8 → Very good performance
- 0.7 < PR < 0.8 → Normal / acceptable range
- PR < 0.7 → Not good, there may be system issues, or environmental factors affecting performance
Let Us Understand with an Example
Suppose a homeowner installs a 5kW solar system on their rooftop in Delhi. In the month of April, the system generates an average of 20 units (kWh) per day. Now, we want to calculate the Performance Ratio.
We know:
PR = Actual Energy ÷ Expected Energy
But here’s the important question: How do we find the expected energy?
Here is the way. The expected energy is generally estimated using:
System Size × Peak Sun Hours (PSH)
For Delhi, the average PSH is around 5.35 hours/day.
Under ideal conditions (no losses, perfect system), expected energy generation would be:
5 × 5.35 = 26.75 kWh/day
Now Calculate PR
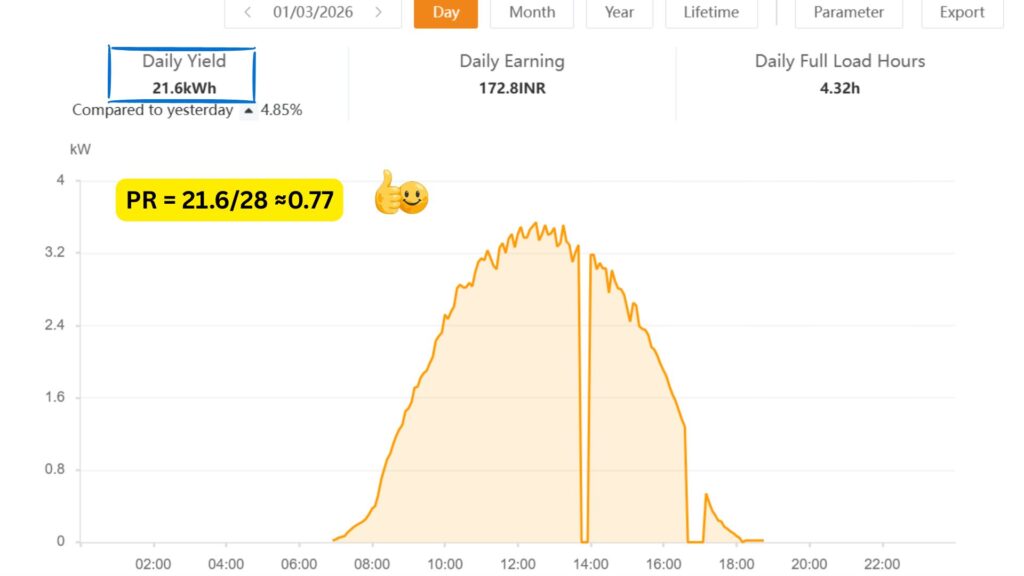
PR = 20 ÷ 26.75 = 0.75
What Does This Mean?
The system is performing at 75% of its ideal capacity.
This falls within the normal performance range, indicating the system is working well under real-world conditions.
And interestingly, even my own system performs in a similar range—which we’ll analyze in detail in the next section.
If you’re a Delhiite, you might be interested in knowing the complete analysis of 5kW solar in Delhi. I have written a detailed guide on “Solar System Cost, Savings & Payback in Delhi (1kW–10kW Guide)“
How Do Losses Affect Solar Performance?
Like any real-world system, a solar power system also experiences certain losses.
And this is completely normal.
Because of these losses, your system never produces its ideal or expected energy.
Let’s understand the main types of losses:
1. Temperature Losses: Solar panels are tested at 25°C (standard conditions). But in real life—especially in India—the panel temperature often goes much higher. As the temperature increases, efficiency decreases. The higher the temperature, the more the energy loss.
2. Conversion Losses: Energy in a solar system changes form:
- Sunlight → DC electricity (in panels)
- DC → AC electricity (through inverter)
During these conversions, some energy is always lost.
3. Transmission (Wiring) Losses: When electricity flows through wires—from panels to the inverter and then to your home— a small part of the energy is lost as heat.
What Do These Losses Result In?
Because of all these losses, the actual energy produced is always less than the expected (ideal) energy
And this difference is exactly what Performance Ratio captures.
Another important loss solar panels suffer within the first few hours of their exposure to the sunlight. Read “Why Do Solar Panels Lose Power After Installation? Understanding the LID Effect“
A Simple Way to Understand Performance Ratio (PR)
Think of your solar system like a car.
The company claims a mileage of 20 km/l.
But in real life:
- Traffic
- Road conditions
- Driving style
You might actually get 15 km/l
That difference between ideal and real performance?
That’s exactly what Performance Ratio represents in a solar system.
How Much Performance Ratio is Considered Good?
Now the important question:
What is a good Performance Ratio?
- 0.7 – 0.8 → Normal and healthy performance
- Above 0.8 → Very good performance
- Below 0.7 → Needs attention (if weather conditions are normal)
How PR Helps You Understand System Health
Performance Ratio is not just a number—it helps you diagnose your system.
But here’s the key point:
PR should always be interpreted along with weather conditions.
Case 1: Low PR but Weather is Bad (Normal Situation)
Let’s say:
A 5kW system in Delhi generates only 12 units in a day due to cloudy weather.
(Expected generation ≈ 26.75 kWh)
PR = 12 / 26.75 ≈ 0.45
At first glance, this looks very low.
But in reality:
This is perfectly normal, because sunlight itself was low.
Case 2: Low PR in Good Weather (Problem Case)
Now imagine the same situation:
- Sunny day
- Clear sky
- Normal conditions
But PR is still 0.45
This is a red flag 🚨
It may indicate issues like:
- Faulty or damaged solar panel
- Diode failure
- Loose wiring causing energy losses
- Cracks or degradation in cells
- Other system design or installation problems
How You Can Monitor PR Easily
Today, most solar systems come with mobile monitoring apps.
You just need to:
- Check actual energy output from your app
- Compare it with expected energy
- Calculate PR
This gives you a quick idea about your system’s health.
A Real Example from My System
On April 17, 2026, my system showed a PR of 0.59.
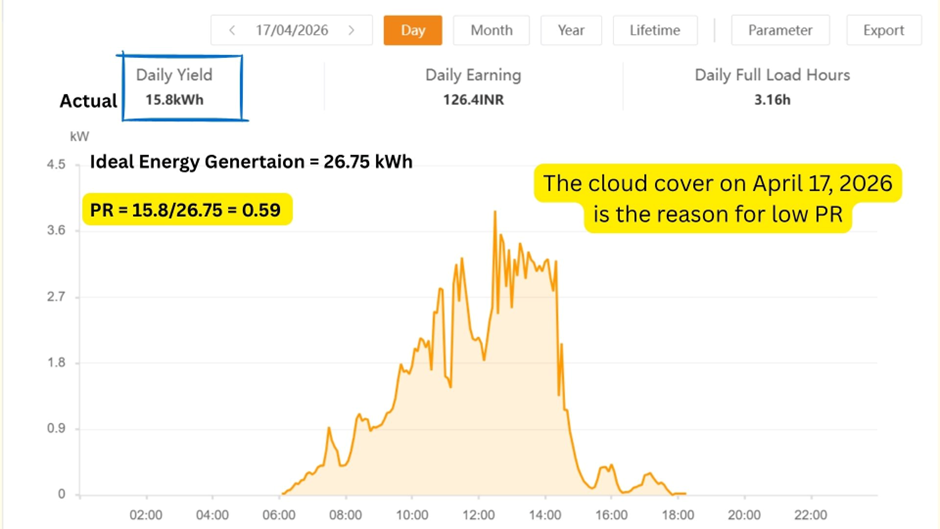
Yes, this is lower than the normal range.
But instead of assuming a fault, I checked the weather conditions.
It turned out to be a cloudy day, which reduced energy generation.
So, in this case:
- The system was fine
- The low PR was due to weather, not a fault
Key Takeaway: A low PR does not always mean a bad system. You must always check the environmental conditions before concluding anything.
This simple understanding can help you avoid unnecessary worry—and also detect real problems at the right time.
Real Case: My Solar System (March 2026 Analysis)
Now let’s analyze the Performance Ratio of my 5.25 kW system for March 2026.
The goal is simple: Is my system performing well? Or does it need attention?
Instead of looking at just 1–2 days, we analyze the entire month. Because short-term drops can happen due to weather, but monthly trends reveal the true system health.
Week 1 (March 1- March 7)
Average PR = 0.78
On March 01, 2026, the PR was 0.77

Summary:
- Mostly clear sky
- Minor temperature effects
- ~45 minutes grid shutdown on March 6
Overall: Good and stable performance
Week 2: (March 8 – March 14)
Average PR = 0.66
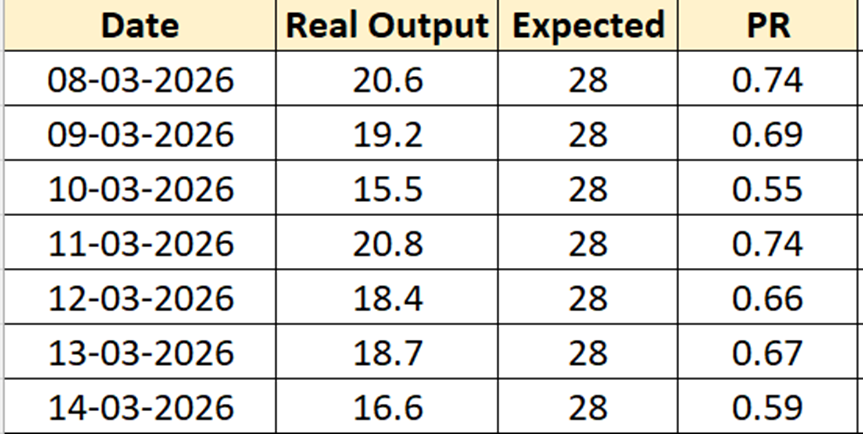
Summary:
- Increase in cloud cover
- More frequent grid interruptions
Overall: Drop in performance due to external factors (cloud cover and rain).
Week 3: (March 15 – March 21)
Average PR = 0.63
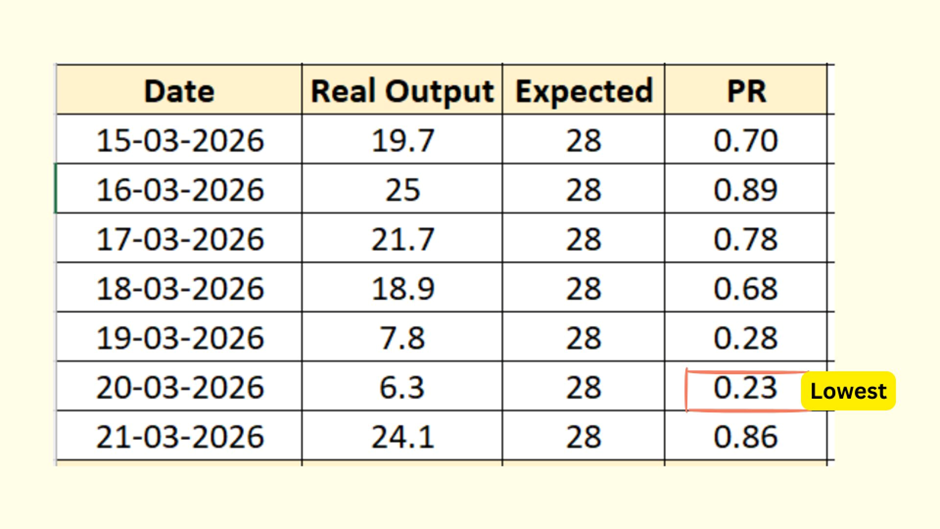
Summary:
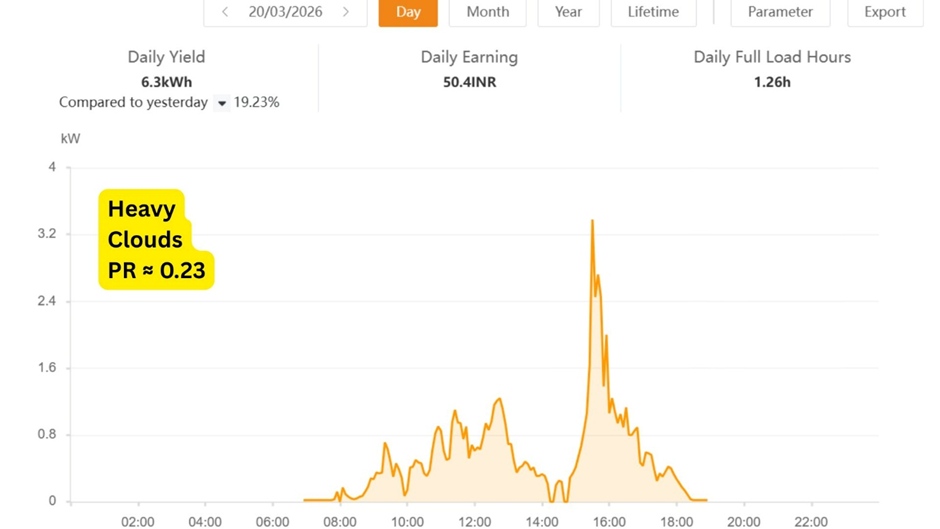
- Lowest PR observed: 0.23 (March 20)
- Heavy clouds and rain
- Significant drop in generation
Overall: Worst performing week (weather-driven)
Week 4: March 22 – March 31
Average PR = 0.74
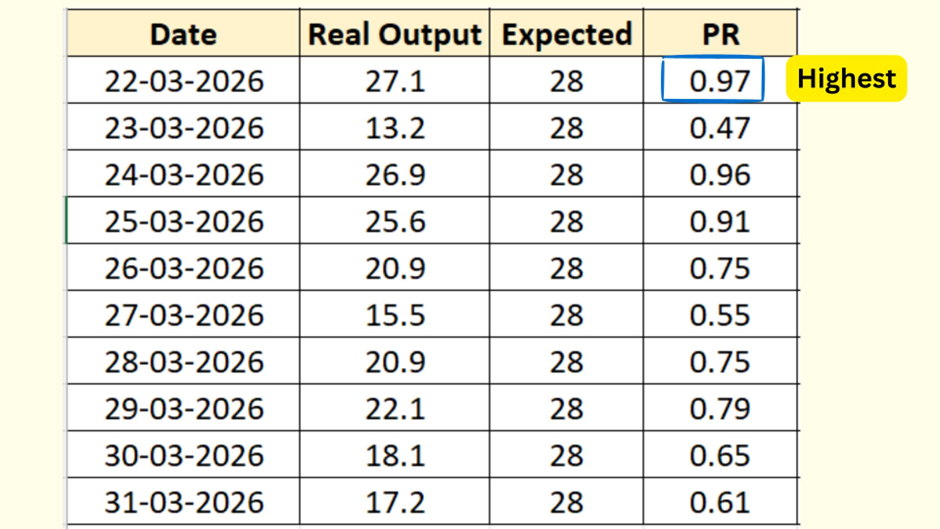
Summary:
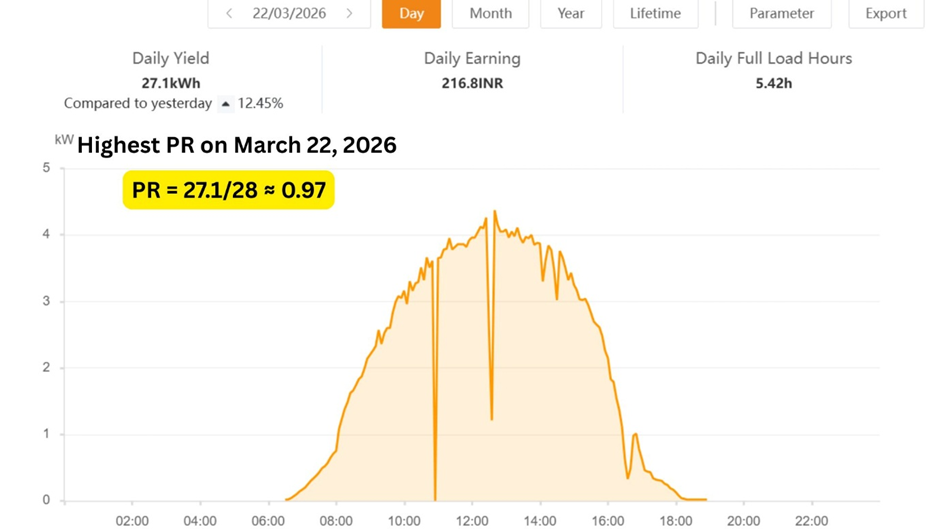
- Highest PR observed: 0.97 (March 22 – clear sunny day)
- Mixed weather (sun + rain)
- Grid shutdown (>3 hours total)
Overall: Recovery with fluctuations
Monthly Performance Summary
Overall PR for March 2026 = 0.71
My Observations & View
Key Observations:
- PR ranged from 0.23 to 0.97 (extreme variation due to weather)
- Weekly averages stayed mostly within 0.63 – 0.78
System Behavior:
- ✅ Best performance → Early March
- ⚠️ Lowest performance → Mid-March (clouds + rain)
- 🔄 Recovery → End of month
Final Conclusion
“From my analysis, the system is performing within an acceptable range.”
The drop in PR during mid-March clearly shows:
The impact of clouds, rain, and grid shutdowns on solar performance.
But since the monthly average PR is within the normal range, the system health is good, and no major issue is present.
Key Takeaway: Don’t judge your solar system based on 1–2 days of low performance.
Always look at weekly and monthly trends before concluding anything.
Interested in Solar but want a complete financial analysis before investing, then try my advanced financial tool SFS – India Edition
Conclusion
Performance Ratio is one of the most important—but most ignored—metrics in solar energy.
If you really want to know whether your system is performing well, don’t just look at total units.
Look at PR.
Because in the end, it’s not just about how much electricity you generate—
it’s about how efficiently your system is working.
“If you don’t know your system’s PR yet, it might be time to check—you could be losing more energy than you think.”
👉 Check your system’s PR today—and if you find something unusual, share it in the comments. Let’s analyze it together.
FAQ
1. What is a good Performance Ratio (PR) for a solar system?
A PR between 0.7 and 0.8 is considered normal and healthy.
A PR above 0.8 indicates very good system performance.
2. Can Performance Ratio (PR) be more than 1?
In practical conditions, PR is usually less than 1.
If it goes above 1, it is often due to calculation errors or incorrect system size assumptions.
3. Why does Performance Ratio decrease on cloudy days?
On cloudy days, the amount of sunlight reaching the panels is reduced.
This lowers the actual energy generation, which results in a lower PR value.
4. How can I check my solar system’s Performance Ratio?
You can check PR by:
- Viewing your daily energy generation in your solar app
- Calculating expected energy (System Size × Peak Sun Hours)
- Applying the formula: PR = Actual ÷ Expected
5. Does a low PR always mean there is a problem in the system?
No. A low PR is normal during cloudy weather, rain, or high temperatures.
But if PR is low even on clear sunny days, then it may indicate a system issue.