Why “Average Solar Savings” Is Misleading (And What You Should Calculate Instead)
If you search online about solar panels, you will often see claims like:
“Install solar and save ₹50,000 per year.”
“Solar panels can save ₹15 lakh over 25 years.”
I come across these claims quite often when reading solar articles and promotional material online.
In fact, even for my own 5 kW grid-tied solar system, such “average savings” numbers are frequently mentioned in discussions about residential solar. These figures sound impressive on paper. But there is one major problem.
Solar savings cannot be described using averages
In reality, the financial performance of a solar system depends on several factors. These include sunlight availability, electricity tariff, system size, installation cost, and local policies such as net-metering.
Because these variables differ from one home to another, the idea of “average solar savings” can often be misleading.
Why “Average Solar Savings” Often Fail
The main reason “average solar savings” can be misleading is that solar economics depends on several variables, and these variables are not uniform across locations or homes.
For example, solar savings depend on factors such as:
- Electricity tariff
- Solar irradiance (sunlight availability)
- System size
- Installation cost
- Net-metering policies
Each of these factors can vary significantly.
For instance, solar irradiance is a variable, which means the amount of sunlight received by solar panels changes from place to place. A home in Rajasthan may receive much higher solar radiation than a home in Kerala.
Similarly, electricity tariffs vary widely across India. Some states have residential tariffs above ₹9 per unit, while others may be closer to ₹5–₹6 per unit. Since solar savings depend directly on the price of electricity being replaced, this difference alone can significantly change the economics of a solar system.
Installation costs can also vary depending on the installer, equipment quality, and local market conditions. Because these variables change from state to state, district to district, and even home to home, the financial performance of solar systems can vary significantly across households.
Why Installers Often Use Average Numbers
It is also important to understand that solar installers are not necessarily at fault when they present average savings estimates.
In many cases, installers use simplified numbers because homeowners want a quick and easy understanding of potential benefits. Presenting a single estimate like “₹50,000 annual savings” helps communicate the general idea that solar can reduce electricity bills.
If the discussion becomes too complex at the beginning — involving detailed financial modelling and multiple variables — some homeowners may feel overwhelmed or hesitate to explore solar further.
However, while simplified numbers can help introduce the concept, they should ideally be followed by a more careful analysis before making an investment decision.
After all, installing solar panels is a long-term financial decision, and understanding the actual economics for your specific home can make a big difference.
Read: Why Two Solar Installers Give Two Different Payback Periods.
It explains why the same rooftop solar system can produce very different financial estimates depending on the assumptions used in the calculation.
Two Homes, Same Solar System — Very Different Savings
To understand the problem with “average solar savings,” consider a simple example.
Imagine two homeowners installing the same 5 kW grid-tied solar system.
| Factor | Home A (Delhi) | Home B (Bikaner, Rajasthan) |
|---|---|---|
| Electricity tariff | ₹8 / unit | ₹7 / unit |
| Peak Sun Hours (PSH) | 5.25 | 5.9 |
| Annual solar generation | Lower | Higher |
| Annual savings | ~₹60,000 | ~₹75,000 |
At first glance, both systems are identical.
They have the same capacity, the same solar panels, and the same inverter.
Yet the financial outcome is quite different.
The home in Bikaner receives stronger solar radiation, which means the system generates more electricity over the year. Even though the electricity tariff is slightly lower, the higher solar generation leads to greater overall savings.
Meanwhile, the Delhi system produces less electricity due to slightly lower sunlight intensity. As a result, the difference in annual savings can easily reach ₹10,000–₹15,000 per year.
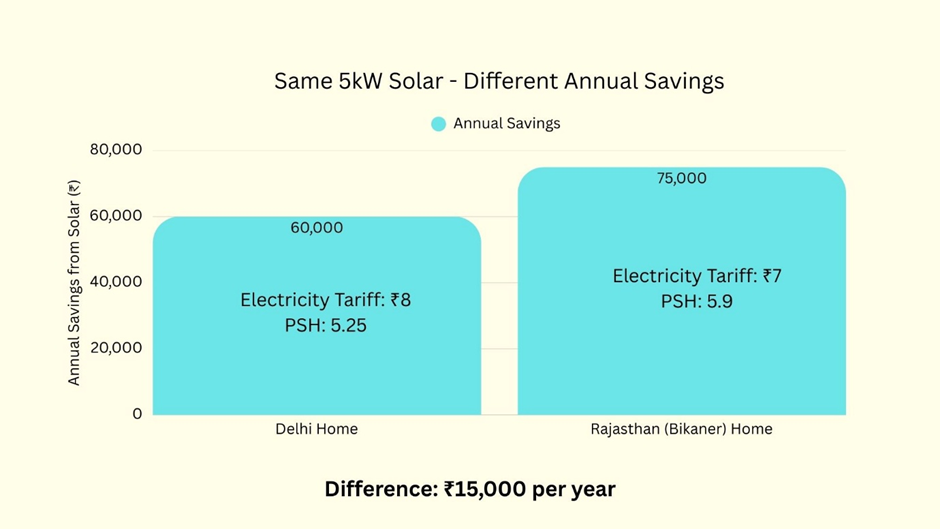
Over the 25-year life of a solar system, this difference can become ₹3–₹4 lakh.
This is precisely why solar projects should be evaluated using location-specific financial analysis rather than generic average savings estimates.
This simple example illustrates why using a single “average solar savings” number can create unrealistic expectations for homeowners.
The real financial performance of solar depends on location, tariffs, and several other project-specific variables.
The Industry’s Use of Simplified Solar Savings Numbers
If you explore solar websites, advertisements, or promotional brochures, you will often come across simplified statements such as:
- “Save ₹50,000 per year with solar.”
- “Recover your investment in just 5 years.”
- “Earn ₹15 lakh savings over the lifetime of your solar system.”
These numbers are attractive and easy to understand. They help communicate the potential financial benefits of solar power simply.
In many cases, such estimates are based on typical assumptions about electricity tariffs, sunlight availability, and system performance.
However, the challenge is that these assumptions may not apply to every home.
As we saw in the earlier example, factors such as local solar radiation, electricity tariff, installation cost, and consumption patterns can significantly influence the financial outcome of a solar system.
Because of these variations, the same 5 kW solar system can produce very different savings for different households.
This does not mean that the simplified numbers used in marketing are incorrect. They may be accurate for certain situations. The issue is that they are often presented as general expectations, even though solar performance and savings are highly location-specific.
For homeowners considering solar, this distinction is important.
Installing a rooftop solar system is a long-term financial investment, often expected to operate for 25 years or more. Making such a decision based only on generalized savings numbers may not provide a clear picture of the actual financial performance.
In reality, solar economics is not about averages — it is about project-specific financial analysis.
Understanding the true economics of a solar system requires evaluating the project using local solar resource data, electricity tariffs, system cost, and expected performance over time.
Read: Why Solar ROI Often Looks Better on Paper Than in Real Life.
This article explains why spreadsheet projections can sometimes appear more attractive than the actual long-term performance of a solar system.
What Homeowners Should Calculate Instead of “Average Savings”
Instead of relying on generalized savings estimates, homeowners should evaluate solar systems using a few key financial and performance metrics.
Some of the most useful metrics include:
- Payback Period – the number of years required to recover the initial investment through electricity savings.
- Return on Investment (ROI) – the overall financial return generated by the solar system over its lifetime.
- Internal Rate of Return (IRR) – a metric commonly used in financial analysis to estimate the profitability of long-term investments.
- Net Present Value (NPV) – the value of future savings expressed in today’s monetary terms.
- Lifetime Energy Generation – the total amount of electricity the solar system is expected to produce during its operational life.
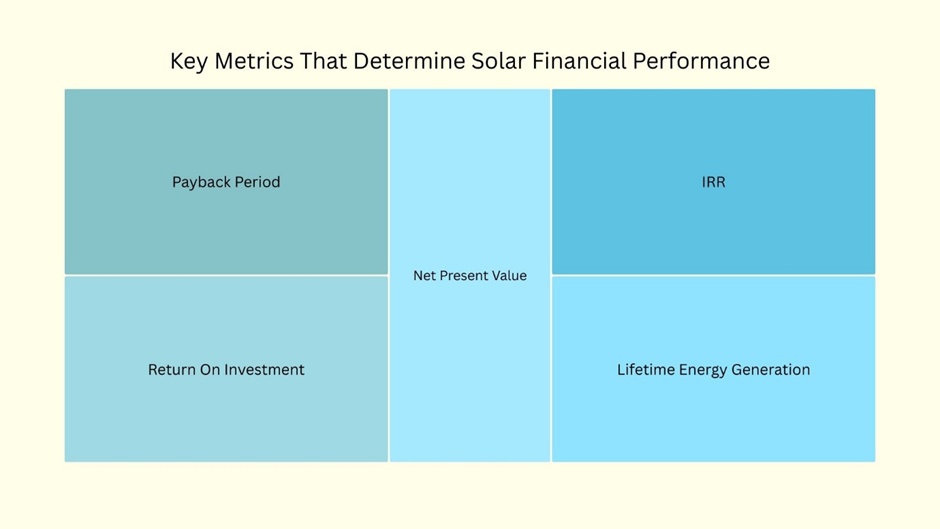
These metrics provide a much clearer picture of the financial performance of a solar system compared to a single “average savings” number.
Most importantly, these calculations depend on location-specific solar resource data, electricity tariffs, and system cost assumptions.
This is why professional solar feasibility studies rely on detailed financial models rather than simplified “average savings” estimates.
Example: Solar in Ghaziabad (Uttar Pradesh)
To illustrate how these metrics work in practice, consider a simplified example based on a 5kW grid-tied rooftop solar system located in Ghaziabad, India.
Using realistic assumptions for solar radiation, electricity tariffs, and system performance, the financial model produces the following estimates over a 25-year system life:
| Metric | Estimated Value |
|---|---|
| Payback Period | ~6 years |
| Internal Rate of Return (IRR) | ~18% |
| Net Present Value (NPV) | ~₹2.5 lakh |
| Total Lifetime Electricity Generation | ~167,700 units |
| Estimated Lifetime Savings | ~₹7.7 lakh |
These numbers show why solar economics cannot be summarized with a single “average savings” estimate.
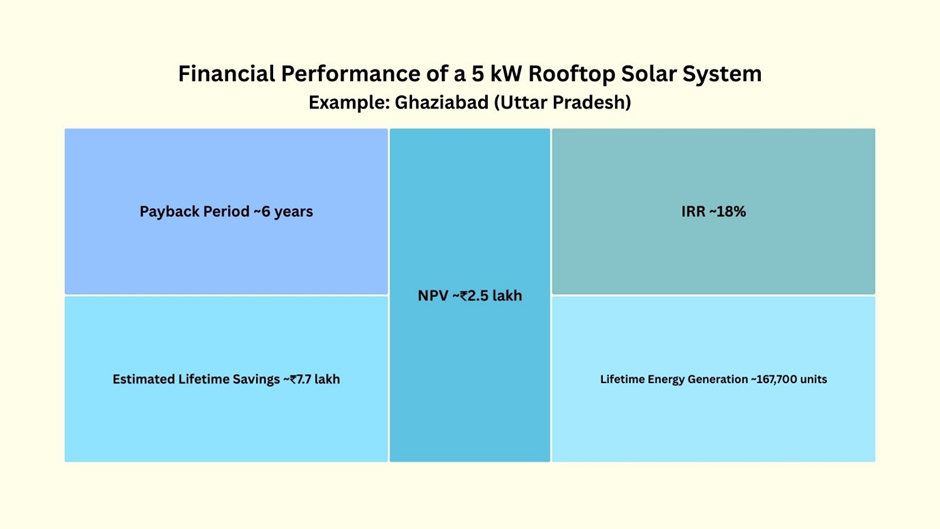
The financial performance of the system depends on multiple inputs, including the local solar resource, electricity tariff, installation cost, and long-term system performance.
By evaluating these parameters together, homeowners can gain a much clearer understanding of whether solar is financially attractive for their specific situation.
This is why accurate solar feasibility analysis requires location-specific data and structured financial modeling rather than simplified national averages.
Read: Why First-Year Solar Savings Don’t Predict Lifetime ROI.
Why Detailed Solar Feasibility Calculations Matter
Because solar savings can vary significantly from one home to another, the most reliable way to evaluate a solar project is through a detailed financial analysis.
Such an analysis should ideally consider several project-specific inputs, including:
- Your electricity tariff
- Your location’s solar resource (irradiance or peak sun hours)
- System size and installation cost
- Net-metering policy and export compensation
- Household electricity consumption patterns
- Expected solar panel performance over time
- Maintenance costs during the life of the system
- Replacement of major components, such as inverters
Each of these factors can influence the financial outcome of a solar installation.
For example, two homes with the same solar system capacity may experience very different annual savings and payback periods if their electricity tariffs, consumption patterns, or solar radiation levels differ.
Because of these variations, evaluating solar projects using simplified averages may not provide a clear picture of the actual financial performance.
A more reliable approach is to use a structured solar feasibility model that incorporates these inputs and estimates metrics such as payback period, lifetime savings, and long-term financial returns.
To simplify this process, I developed a Solar Feasibility Spreadsheet (SFS) – India Edition and US Edition that calculates solar ROI, payback period, and lifetime savings using project-specific inputs.
Such tools allow homeowners to evaluate solar investments using realistic assumptions rather than generalized averages.
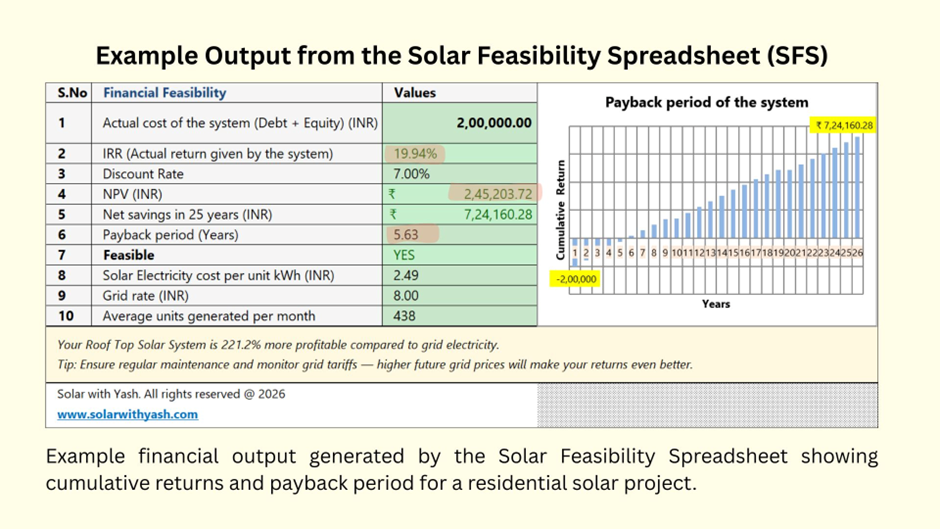
Example: Financial Analysis of a Residential Solar System
To better understand how solar economics should be evaluated, consider a simplified example of a 4kW residential rooftop solar system installed in Delhi–NCR (Ghaziabad region).
Using realistic assumptions for electricity tariffs, solar radiation, and system performance, the financial model can estimate the long-term performance of the system.
For this example, assume the following inputs:
- Electricity tariff: ₹8 per unit
- Average solar resource (PSH): ~5.25 hours/day
- System installation cost: ₹2,00,000
Using these inputs, a detailed solar feasibility model produces the following estimates over a 25-year system life:
| Metric | Estimated Value |
|---|---|
| Payback period | ~5.6 years |
| Internal Rate of Return (IRR) | ~20% |
| Net Present Value (NPV) | ~₹2,45,000 |
| Lifetime electricity generation | ~167,000 units |
| Total net savings in 25 years | ~₹7,24,000 |
In this example, the system recovers its investment in about 5.6 years, generates roughly ₹7.2 lakh in net savings over 25 years, and delivers an estimated IRR of around 20%. These results provide a clearer picture of the solar system’s financial performance.
Instead of relying on a generic statement such as “solar can save ₹50,000 per year,” this type of analysis evaluates the project using real inputs and long-term financial metrics.
This approach allows homeowners to understand:
- how quickly their investment will recover,
- how much electricity the system will generate over its lifetime, and
- what the long-term financial return is likely to be.
Such insights are far more meaningful than a single “average savings” estimate, which may or may not apply to a specific home.
Understanding Solar Economics Before You Invest
Before investing thousands of rupees in a rooftop solar system, it is important to understand the actual financial performance of the project for your specific home.
Average savings numbers may sound attractive, but they rarely capture the full economics of a solar installation.
A structured solar feasibility calculation can provide a much clearer picture of expected savings, payback period, and long-term returns by incorporating factors such as local solar radiation, electricity tariffs, system cost, and performance assumptions.
To simplify this process, I developed a Solar Feasibility Spreadsheet (SFS) that allows homeowners to estimate the payback period, ROI, and lifetime savings of a solar system using project-specific inputs.
You can explore the tool here: → Solar Feasibility Spreadsheet (SFS)
Tools like this help homeowners evaluate solar projects using location-specific data and realistic financial assumptions, rather than relying on generalized average savings estimates. Solar can be a highly attractive investment for many homeowners. But like any long-term investment, its true value becomes clear only when it is evaluated using proper financial analysis rather than generalized averages.