Why Solar ROI Often Looks Better on Paper Than in Real Life
An analytical breakdown of why solar ROI projections often look higher on spreadsheets — and how homeowners can evaluate real returns.
When a homeowner decides to go solar, the number that attracts the most attention is usually the Solar ROI (Return on Investment).
Spreadsheets, installer proposals, calculators, and online solar tools often show very exciting returns — sometimes 18%, 20%, or even higher. Many homeowners move forward with the installation based on these optimistic expectations.
But after some time passes, they begin to realise that the actual return does not fully match what was shown on paper. A noticeable gap starts to appear between projected ROI and real-world performance. If you are new to solar calculations, you may first want to understand why two installers often give completely different payback numbers.
Does this mean solar is a bad investment?
Absolutely not.
It simply means that most calculations assume everything will remain perfectly aligned — static electricity prices, ideal system performance, and consistent operating conditions throughout the life of the project. In reality, solar operates in a dynamic environment where technical performance, financial variables, and real-life usage patterns keep changing over time. In this article, we will explore the technical factors and financial assumptions that often create this “perfect spreadsheet” picture of 20%+ ROI. The goal is not to reduce confidence in solar, but to help homeowners move beyond imaginary numbers and understand realistic returns — so that their decision to go solar is based on clarity, not over-expectation.
🎥 Prefer watching first? Here’s a quick breakdown of why solar ROI often looks better on paper.
This video explains the core concept — the detailed analytical breakdown continues below.
Hidden Technical Losses That Reduce Real ROI
Yes, most solar installers, online tools, and spreadsheets do include system losses or degradation. However, these losses are often represented as a single fixed percentage. In reality, solar performance is influenced by dynamic environmental conditions and component-level variations, which cannot always be captured by one number.
Each solar installation behaves differently. Environmental factors change over time, system degradation does not follow a perfectly uniform path, and every component within the system introduces its own efficiency loss. When these variables are combined, the result is usually a range of performance, not a precise single value. In many cases, this real-world range of losses can be higher than what calculators or standard proposals assume — which makes the projected ROI appear more attractive on paper.
Let us look at some typical hidden losses that affect real-world performance:
Temperature Loss
Every solar power system experiences reduced output as cell temperature rises. Two identical systems installed in different climatic zones will have different performance losses. Assuming a single temperature loss percentage in a proposal can make solar ROI look more attractive than it actually is. In hotter regions, temperature-related losses may reach 7–8%, while in cooler locations they could be as low as 2%.
Dust and Soiling
Even a thin layer of dust can reduce energy generation.
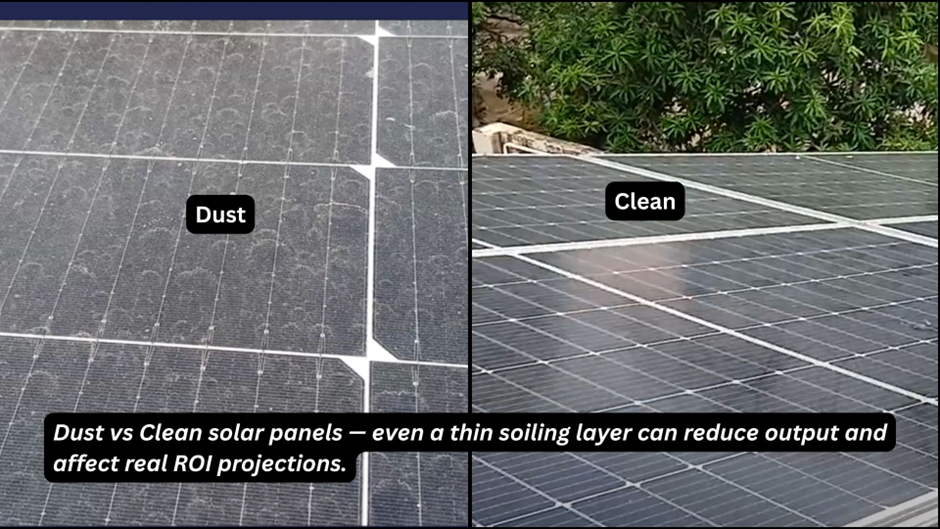
Cleaning frequency, local air quality, and homeowner behaviour play a major role in annual output. One household may clean panels regularly, while another may do so only occasionally. Assuming identical soiling losses — and therefore identical ROI — does not reflect real usage patterns.
Wiring and Conversion Losses
Inverters, cables, and connectors introduce small inefficiencies. Individually, these losses appear minor, but together they influence long-term system performance. Many simplified solar tools underestimate or generalise these inefficiencies, which can lead homeowners to see a more optimistic ROI.
Partial Shading and Changing Surroundings
Nearby buildings, trees, or seasonal shading can slightly reduce production, especially during morning and evening hours. A rooftop that appears completely shade-free during installation may experience shading years later if a new multi-storey building is constructed nearby.

Real-world surroundings change over time — which is why assuming a fixed generation value in ROI calculations can sometimes be misleading.
In such cases, an initially exciting ROI projection can quickly drop — highlighting the gap between assumptions and real-world conditions.
None of these factors makes solar unreliable. Instead, they explain why the difference between “paper generation” and “real generation” exists — and why understanding realistic losses is essential for evaluating true ROI.
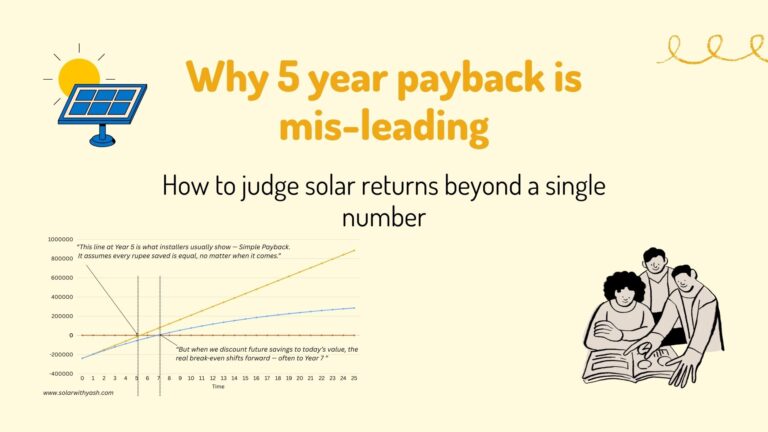
Many homeowners first calculate payback using simplified numbers, but understanding the difference between simple and real payback is essential before analysing ROI.
Financial Assumptions That Inflate Returns
Technical performance is only one side of the solar equation. Financial modelling plays an equally important role in shaping ROI projections. Many spreadsheets rely on simplified financial assumptions that can unintentionally inflate expected returns.
Let us look at some common factors that make ROI appear stronger on paper than in real life.
Electricity Tariff Inflation
Many ROI calculations assume electricity prices will rise by 7–10% every year. While tariffs do increase over time, the actual rate varies significantly based on state policies, regulatory decisions, and consumer categories. If tariff growth turns out lower than assumed, the projected savings decrease — and so does the real ROI. A difference of even a few percentage points in annual tariff escalation can change long-term financial outcomes.
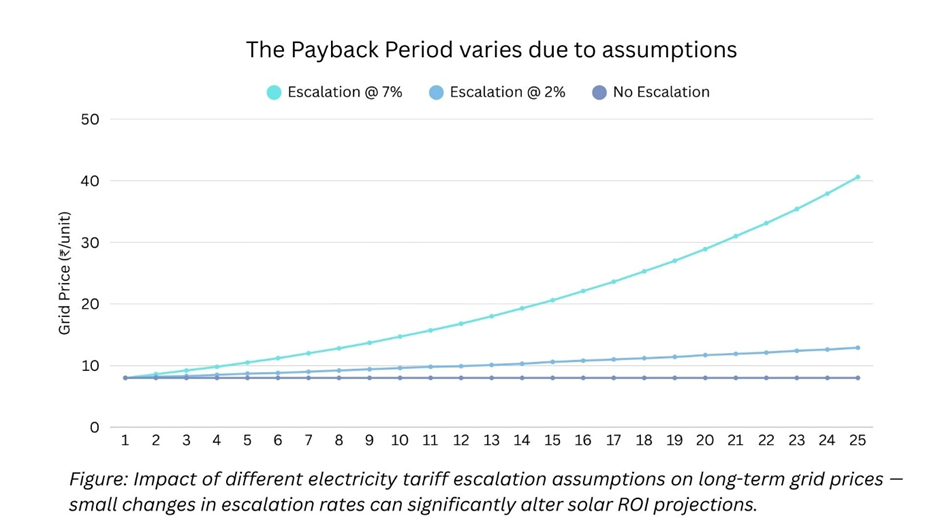
This is one of the reasons why solar payback is not a fixed number and can vary significantly depending on financial assumptions.
Perfect Consumption Matching
As explained in the video above, some spreadsheets assume that all solar energy offsets expensive grid electricity at the same value. In reality, export policies, net-metering rules, and daytime consumption patterns influence how much solar generation truly translates into savings.
The same solar system can deliver very different effective electricity value depending on consumption behaviour. For example, a household that consumes only 30% of its solar generation and exports 70%
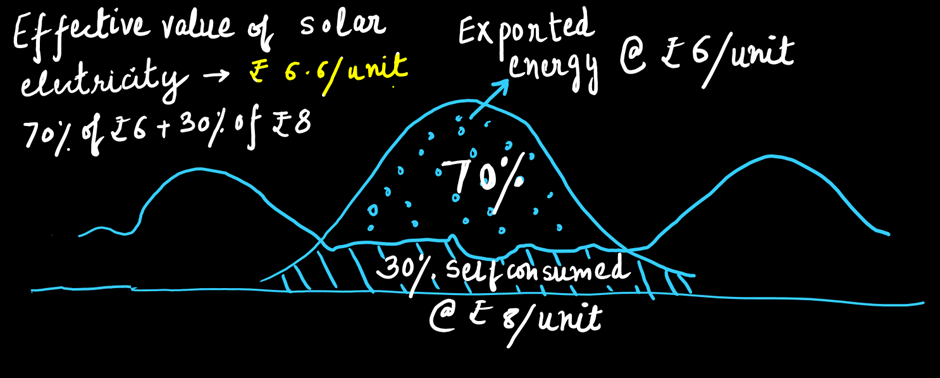
may achieve a lower ROI than a family that self-consumes 70% and exports only 30%, even if both systems are of the same size.
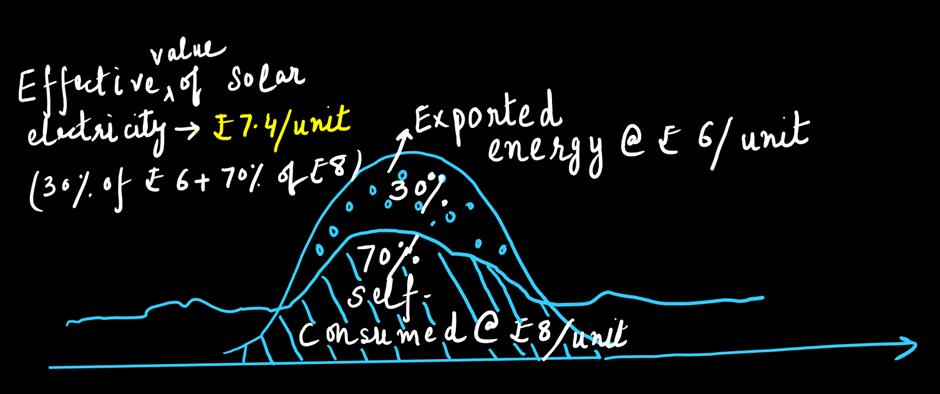
Assuming perfect energy matching can therefore inflate projected returns.
This difference in the effective electricity value is often ignored in simplified ROI spreadsheets, which assume perfect matching of consumption.
Ideal System Life Time Assumptions
Financial models often assume that components perform exactly according to manufacturer specifications for decades. While modern solar systems are highly reliable, real-world maintenance and replacement timelines can slightly shift financial outcomes. Inverters, for instance, are dependable but typically have a practical lifespan of around 10–12 years. Most systems may require at least one inverter replacement during their lifetime.
Ignoring these future costs can make ROI appear higher and create expectations of consistently double-digit returns.
Subsidy Psychology and Perceived ROI
Government subsidies make solar more affordable, but they can also make early ROI projections look unusually attractive.
This happens because:
- Many homeowners calculate ROI using only the post-subsidy cost without considering timelines, approvals, or eligibility conditions.
- Delays in subsidy disbursement can affect short-term cash flow, even if the long-term investment remains strong.
Subsidies are beneficial and play an important role in adoption, but they should be treated as one part of the financial picture — not the entire story.
Simple ROI vs Analytical ROI
One of the biggest differences I see between installer proposals and analytical feasibility studies is the way ROI is defined.
Simple ROI focuses on quick numbers:
- System cost
- Estimated annual savings
- Basic payback period
In many solar proposals, the annual ROI is calculated using a very straightforward formula:

For example, if a homeowner installs a solar system costing ₹3,00,000 and saves ₹45,000 per year on electricity bills:

Some proposals even claim extremely fast returns based on optimistic assumptions, which is why homeowners should be cautious when they hear about very short payback timelines.
This approach is simple, easy to understand, and useful for quick comparisons. However, it assumes that savings remain constant every year and that system performance behaves exactly as expected.
Because of this simplicity, it may overlook deeper variables such as:
- Performance ratio variations
- Real consumption behaviour
- Tariff scenarios
- Financial discounting
Analytical ROI
Analytical ROI, on the other hand, treats solar as a long-term energy asset rather than a one-time purchase. Instead of looking at just one year’s savings, it evaluates the project’s entire cash flow over its lifetime.
This is often calculated using a financial concept called IRR (Internal Rate of Return), which considers:
- Year-wise savings
- Panel degradation
- Electricity tariff changes
- Replacement costs (like inverter replacement)
- Time value of money
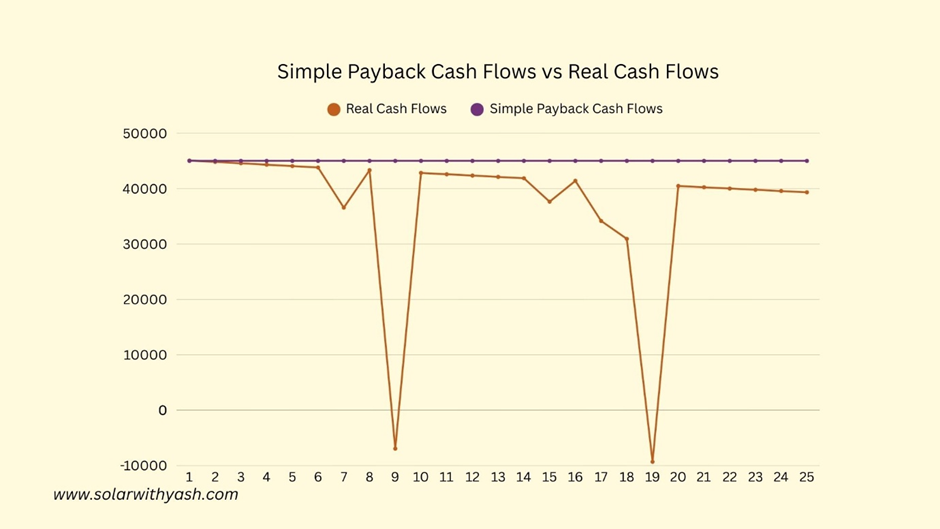
In simplified terms, analytical ROI finds the annual return that makes the total discounted savings equal to the initial investment:

Here, r represents the real annual return of the solar project.
Let us consider a simple example. Suppose a ₹3,00,000 system generates savings that start at ₹45,000 per year but gradually change due to tariff growth and system degradation, and an inverter replacement cost occurs in year 12. When these real cash flows are analysed together, the analytical ROI may come out to around 11–12%, even though the simple annual ROI initially appeared to be 15%.
This does not make solar less valuable — it simply makes the financial picture more realistic.
As homeowners become more aware, this analytical approach helps them make calmer, more confident decisions because expectations are built on realistic scenarios rather than perfect assumptions.
If you want to evaluate solar ROI using analytical assumptions instead of simplified numbers, you can explore my Solar Feasibility Spreadsheet – India Edition and U.S. Edition, a tool I use to analyse solar ROI under real-world scenarios.
Why This Doesn’t Mean Solar Is a Bad Investment
It’s important to understand the real message here:
Solar is still one of the most reliable ways to reduce electricity costs and gain energy independence.
The goal is not to reduce enthusiasm — it is to replace unrealistic expectations with informed confidence.
When ROI is calculated conservatively:
- Payback periods become more realistic.
- Savings feel more satisfying because they meet expectations.
- Decision-making becomes less stressful.
In my experience, homeowners who understand the difference between “paper ROI” and “real ROI” are actually more satisfied with their solar investment over time.
How Homeowners Should Evaluate Solar ROI Properly
Before you commit to a system, consider asking these questions:
1. What assumptions were used for sunlight and system performance?
Look for realistic performance ratios rather than ideal numbers.
2. What electricity tariff growth rate is assumed?
Ask for multiple scenarios instead of a single optimistic projection. You can also compare real-world regional examples to see how ROI changes across states.
3. Does the calculation include real consumption behaviour?
Daytime usage patterns can significantly affect savings.
4. Are maintenance and replacement factors considered?
Even small adjustments can change long-term ROI.
A good solar analysis does not promise the highest return — it aims to give you the most reliable expectation.
The Bottom Line
Solar ROI often looks better on paper because spreadsheets describe a perfectly predictable world. Real rooftops operate in a living environment influenced by weather, behaviour, and policy changes.
That doesn’t reduce the value of solar — it simply means that thoughtful analysis matters.
If you approach solar with realistic assumptions instead of perfect projections, the investment becomes clearer, more stable, and ultimately more rewarding.
And in the long run, confidence built on realistic numbers is far more powerful than excitement built on perfect spreadsheets.
If you want a deeper step-by-step framework to evaluate solar feasibility beyond simple payback numbers, I’ve explained the full process in my ebook: Why Solar Payback Calculations are wrong.