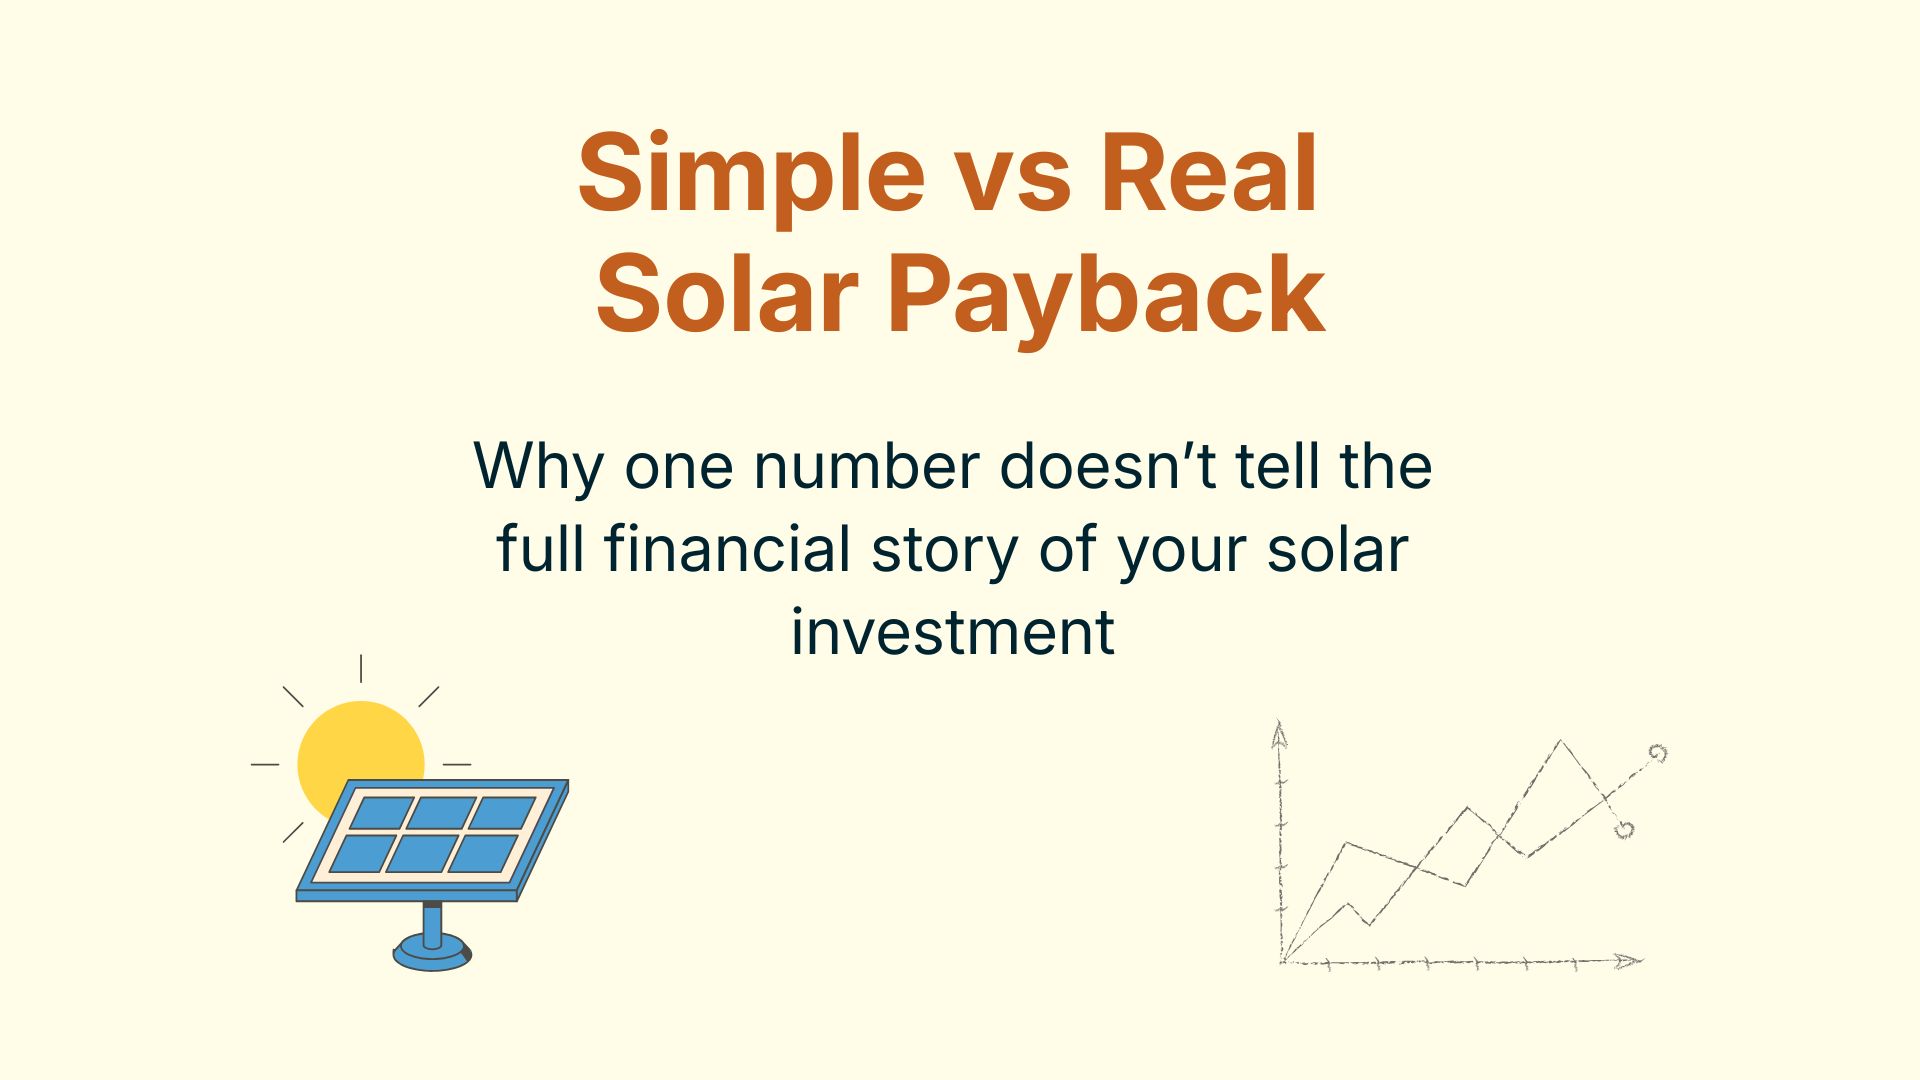
Simple Payback vs Real Payback in Solar: What Homeowners Must Know Before Investing
This guide explains the difference between simple vs real solar payback, helping homeowners understand how solar savings and cash flows evolve.
When homeowners ask how long a solar system takes to pay back, they often expect a single, definitive number. In reality, payback is not a universal concept. It depends on how the calculation is done and what assumptions are included.
Different payback methods answer different questions. Some are designed for quick comparisons, while others attempt to reflect how money actually flows over time. Problems arise when a simple metric is treated as a complete financial picture.
This article is about understanding the math behind different payback approaches, so homeowners can interpret numbers correctly.
What is Simple Payback?
Simple payback is the most basic way of estimating how long a solar system takes to recover its upfront cost. It is calculated by dividing the initial system cost by the annual electricity bill savings.
For example:
- Initial Cost = ₹2,40,000
- Annual Savings = ₹50,000
- Payback = ₹2,40,000/₹50,000 = 4.8 years
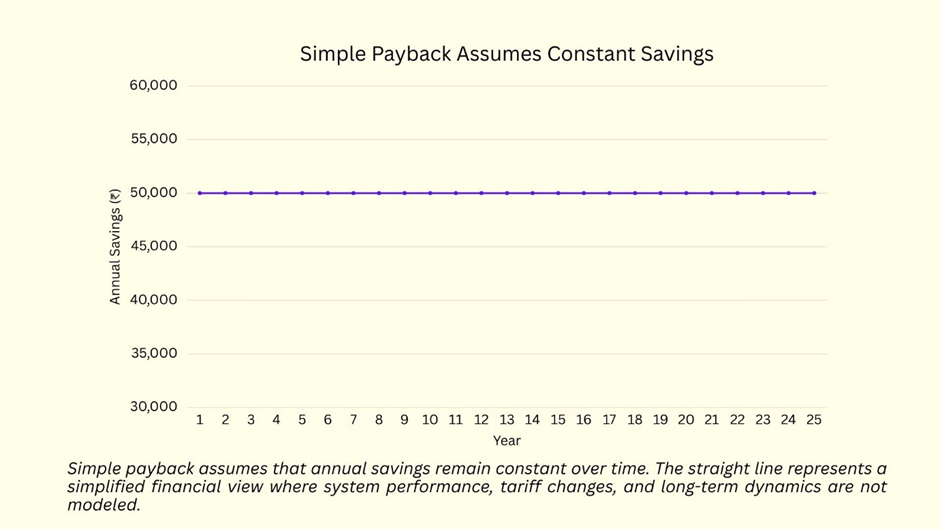
In this approach, annual savings are treated as constant from year to year. The calculation does not attempt to model how system performance, electricity prices, or costs might change over time.
Simple payback is widely used because it is easy to understand and communicate.
Why Simple Payback Exists
Simple payback exists for a practical reason: it offers a quick, first-level estimate.
For homeowners comparing multiple options — different system sizes, vendors, or prices — simple payback provides a common reference point. It allows people to answer a basic question without getting into complex financial modeling.
In early-stage decision-making, this simplicity can be useful. It reduces friction and helps homeowners engage with the idea of solar without being overwhelmed by numbers.
What Question Simple Payback Actually Answers
Simple payback answers only one specific question:
“If my annual savings stayed the same every year, how many years would it take to recover the upfront cost?”
It does not attempt to describe what happens in reality over 20 or 25 years. It does not claim to reflect changing conditions or long-term cash flows.
Also, it ignores the project cash flows once the payback is achieved.
Understanding this limitation is key. Simple payback is not wrong — it is simply narrow in scope.
Problems arise only when this narrow estimate is treated as a complete measure of financial performance.
Where Simple Payback Starts to Break Down
Simple payback is designed to be simple — and that simplicity is both its strength and its limitation. It works well as a quick estimate, but it begins to lose clarity when real-world conditions change over time.
Understanding these limits does not mean the method is wrong. It simply means that the question being asked becomes larger than what a simplified metric can capture.
It Assumes Constant Annual Savings
Simple payback treats annual savings as if they remain unchanged throughout the life of the system. In practice, several factors can influence how savings evolve.
Electricity tariffs may rise, fall, or change structure depending on policy and consumption patterns. At the same time, solar systems do not produce the same amount of energy every year. Performance can gradually degrade due to natural aging and environmental conditions.
When savings are assumed to be perfectly flat, the calculation becomes easier — but the picture becomes less dynamic.
It Ignores the Time Distribution of Cash Flows
Another limitation is that simple payback focuses only on the total amount recovered, not on when those savings occur.
Savings in the early years may feel more impactful than those made much later. Years 1 and 12 are treated as identical in the calculation, even though the financial experience of those years can be very different for a homeowner. In reality, solar savings often follow a pattern rather than a straight line. Some systems provide financial benefits early in their life, while others show a more gradual accumulation of value. Simple payback does not distinguish between these timelines — it only counts the total years until recovery.
It Does Not See Mid- and Later-Life Events
Over a long operating period, real systems can experience events that usually occur outside a basic payback formula.
Components may need replacement, such as the solar inverter, after many years of operation. System performance can slowly degrade as equipment ages. Policies related to net-metering or billing structures may also evolve depending on regional energy strategies.
Simple payback does not attempt to include these possibilities. Its goal is speed and clarity, not long-term modeling — which is why it works best as an early estimate rather than a full financial picture.These limitations do not invalidate simple payback — they simply highlight why many analysts move toward a more realistic interpretation of payback when making long-term decisions.
What Do We Mean by Real Payback?
After understanding how simple payback works — and where its limits begin — many homeowners naturally ask a deeper question: Is there a way to look at payback that reflects how savings actually unfold over time?
This is where the idea of real payback becomes useful. It is not a replacement for simple payback, and it is not a new financial formula. Instead, it is a more realistic way of interpreting payback by considering how solar systems behave in the real world.
Real Payback Is Not a New Formula
Real payback is best understood as a modeling approach, not a separate equation. The underlying idea remains simple: identify the point at which total savings recover the initial investment.
What changes is how those savings are modeled. Instead of assuming that annual savings remain identical every year, real payback allows savings to evolve based on realistic conditions — such as gradual system aging, financial assumptions, and long-term uncertainty.
In other words, real payback does not change the destination; it changes the path used to get there.
What Changes When You Move Beyond Simple Payback
When analysis moves beyond simple payback, several practical elements come into view:
- Variable annual savings: Real systems rarely produce identical financial outcomes each year. Savings may change as electricity pricing, consumption patterns, or modeling assumptions evolve.
- System aging: Solar panels and associated equipment gradually change performance over time. A realistic model reflects this instead of assuming perfectly constant output.
- Mid-life costs: Long operating periods may include maintenance or component replacement events. While not guaranteed, acknowledging their possibility gives a more balanced perspective.
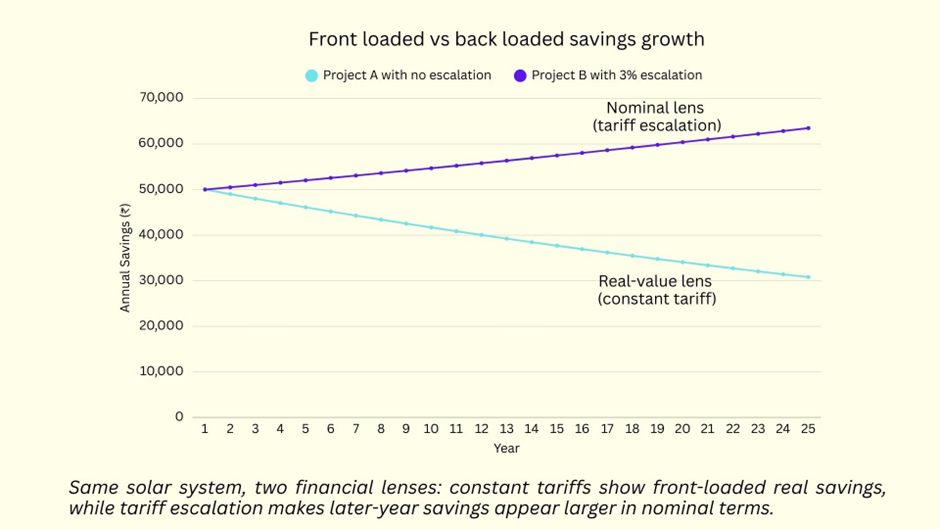
- Realistic escalation logic: Some models include tariff escalation, while others keep tariffs constant in real terms and apply discounting. The key idea is consistency — not optimism.
These adjustments do not make the analysis more complicated for its own sake; they simply allow the payback timeline to reflect how cash flows actually behave.
The Question Real Payback Answers
If simple payback asks, “How many years until total savings equal cost?”, then real payback asks a more grounded question:
“When does my cumulative cash flow turn positive under realistic conditions?”
This subtle shift changes how homeowners interpret the timeline. Instead of viewing payback as a single static number, real payback frames it as a financial journey shaped by time, assumptions, and uncertainty.
If you want to see how real cash-flow modeling changes payback timelines, I’ve built a structured Solar Feasibility Spreadsheet – India Edition and U.S. Edition that lets homeowners test assumptions instead of relying on a single number.
Simple vs Real Payback — Side-by-Side Comparison
Both simple payback and real payback aim to answer the same fundamental question — how long it takes for a solar investment to recover its cost. The difference lies in how each method interprets time, assumptions, and financial reality.
The table below highlights the conceptual differences:
| Aspect | Simple Payback | Real Payback |
|---|---|---|
| Savings pattern | Assumes flat annual savings | Allows savings to vary over time |
| System aging | Not explicitly considered | Gradual performance changes/degradation included |
| Mid-life costs | Typically ignored | Can be incorporated when relevant |
| Purpose | Quick estimate and early comparison | Decision-grade financial insight |
| Risk visibility | Low — fewer assumptions shown | Higher — assumptions become visible |
Simple payback offers speed and simplicity, which makes it useful during early exploration. Real payback, on the other hand, provides a broader view by acknowledging that solar savings evolve. Neither approach is inherently wrong — they simply serve different stages of decision-making. Understanding these differences helps explain why two analyses of the same solar system can produce very different payback timelines.
Which Payback Should a Homeowner Use — and When?
After seeing the differences between simple payback and real payback, a natural question arises: Which one should homeowners actually rely on?
The answer is not about choosing one method over the other. Instead, it’s about understanding when each approach makes sense during the solar decision journey.
When Simple Payback Is Acceptable
Simple payback works well as a starting point. For many homeowners, it provides an easy way to explore solar without getting overwhelmed by complex financial models.
- Early-stage comparison: When evaluating multiple quotes or system sizes, simple payback offers a quick reference that helps narrow options.
- Rough filtering: If a system’s simple payback already feels too long for your expectations, it may signal that further analysis is needed before moving forward.
- Educational understanding: For those new to solar economics, simple payback introduces the idea of cost recovery straightforwardly.
Used in this context, simple payback is not misleading — it is simply a first step.
When Real Payback Becomes Necessary
As decisions become more serious and financially significant, homeowners may benefit from a more realistic interpretation of payback.
- High-cost systems: Larger investments deserve a deeper look at how savings evolve rather than relying on a single static estimate.
- Tight budgets: When monthly cash flow matters, understanding how savings change year by year can provide greater clarity and confidence.
- Long ownership horizon: Homeowners planning to stay in the same house for many years may want to consider system aging, policy changes, and long-term assumptions.
- Investment mindset: Those who view solar as part of a broader financial strategy often prefer decision-grade modeling instead of simplified averages.
Real payback does not replace simple payback — it simply becomes more relevant as the decision moves from curiosity to commitment.
The goal is not to complicate solar decisions, but to match the level of analysis with the importance of the investment.
A Practical Way to Think About Payback (Mental Model)
Financial concepts often feel abstract until they are connected to everyday experiences. One helpful way to understand the difference between simple payback and real payback is through a few familiar analogies.
Fixed Salary vs Freelance Income
Imagine two people earning money in different ways.
A fixed-salary job provides the same amount every month. It is predictable, easy to estimate, and simple to explain — much like simple payback, which assumes savings remain constant year after year.
Freelance income, however, changes over time. Some months are stronger, others quieter. To understand long-term earnings, you would need to look at patterns rather than a single average number. This is similar to real payback, where savings evolve as conditions change. Both views describe income — they simply reflect different levels of detail.
The Core Idea
Simple payback helps homeowners start the conversation. Real payback helps them understand the journey.
Neither approach is wrong — they simply serve different purposes depending on how deeply someone wants to evaluate their solar investment.
How This Fits Into a Complete Solar Feasibility Analysis
Understanding simple payback and real payback helps clarify how long a system may take to recover its cost — but payback alone does not define the full financial story.
Payback is a useful milestone, yet it does not measure total profitability, long-term stability, or the range of possible outcomes. Two systems with similar payback periods can still perform very differently over their lifetime, depending on assumptions and usage patterns.
Payback Is Not the Same as Profitability
A shorter payback does not automatically mean a better investment. Profitability depends on how savings accumulate after the payback point, how costs evolve, and how the system performs across many years. Looking beyond a single number allows homeowners to see the broader financial picture.
Payback Is Not a Complete Risk Analysis
Simple timelines cannot fully capture uncertainty. Electricity pricing structures, policy adjustments, or household consumption changes may influence future savings. A feasibility approach focuses on understanding assumptions rather than treating projections as guarantees.
What Real Feasibility Analysis Includes
A complete solar feasibility analysis usually goes beyond payback by examining:
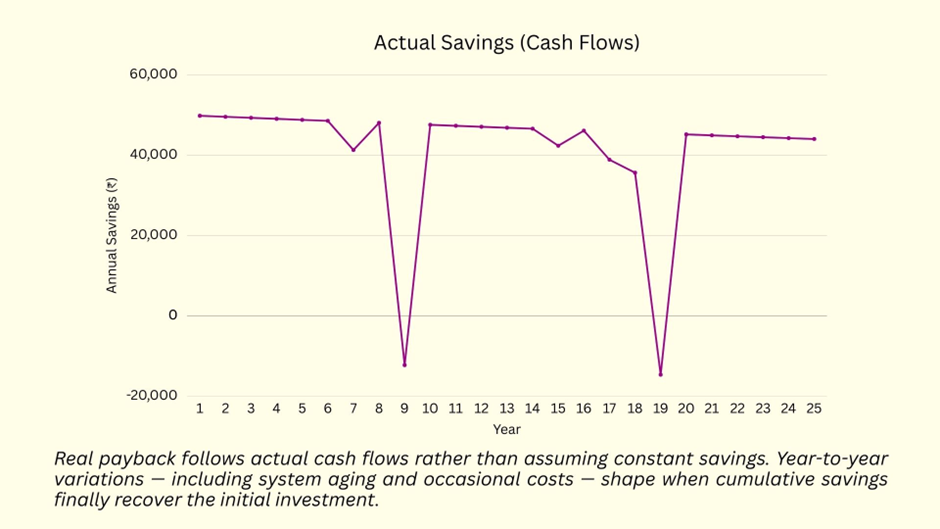
- Detailed cash flows: Understanding how savings change year by year rather than assuming a flat pattern.
- Transparent assumptions: Clarifying how tariffs, system aging, and financial factors are modeled.
- Scenario testing: Exploring how outcomes shift under different conditions, helping homeowners make decisions with confidence rather than guesswork.
If you’re curious about why many solar discussions focus heavily on short payback timelines, I’ve explored the math behind common “5-year payback” claims in a separate article. Tools and structured models can also help translate these concepts into practical feasibility analysis without relying on a single headline number.
Final Takeaway
- Simple payback is not “wrong.” It serves as a quick, easy starting point for understanding solar economics.
- It is simply incomplete. A flat estimate cannot capture how real cash flows evolve.
- Real payback adds decision clarity. By reflecting realistic assumptions, it helps homeowners see the full financial journey — not just a headline number.
- Knowing the difference protects homeowners. It allows decisions to be based on understanding rather than expectations alone.
Solar payback is not just a number — it is a perspective. Choosing the right lens helps homeowners move forward with clarity and confidence.
FAQ
What is simple solar payback?
Simple payback estimates how many years it takes for solar savings to recover the upfront system cost, assuming annual savings remain constant.
What is real solar payback?
Real payback tracks cumulative cash flows using realistic assumptions such as system aging, changing savings patterns, and long-term financial factors.
Is simple payback wrong?
No. Simple payback is useful for quick comparisons, but it does not reflect how solar cash flows evolve over time.
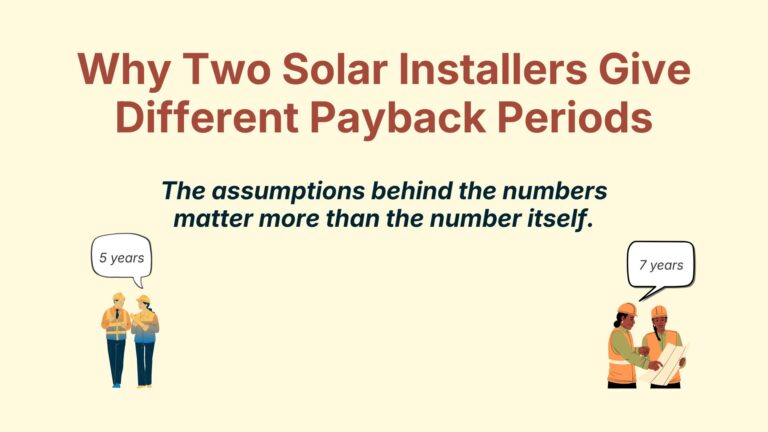
Why do simple and real payback show different timelines?
Because real payback considers variable savings, possible mid-life costs, and financial assumptions, while simple payback assumes flat annual savings.
Which payback method should homeowners use?
Simple payback works for early estimates, but real payback becomes more useful when making serious financial decisions about solar.
Does payback mean solar is profitable?
Not necessarily. Payback shows cost recovery, but full feasibility analysis also considers long-term savings, assumptions, and risk factors.