1kW Solar Generation India: Real Output (22-Day Data 2026)
When I was first planning to install solar on my own house, one question kept coming to my mind:
How much electricity does a 1kW solar system actually generate?
And if you’re considering solar right now, chances are the same question is running through your mind, too. At first, it seems like there should be a simple answer. In fact, most websites will tell you something like:
“1kW solar generates around 4 units per day.”
But here’s the reality: A 1kW solar system does not generate the same electricity everywhere in India. The actual generation depends on several factors, such as:
- Your location (sunlight availability)
- Tilt and orientation of panels
- Shading conditions
- Overall system efficiency
- Your maintenance behaviour
Even something as basic as sunlight is not identical across locations. No two cities have the same solar resource. For example, if you compare Jaipur, Delhi, and Kochi, the difference in annual generation can easily be in the range of 20–30%. That’s a significant variation — and it directly impacts your savings and solar payback.
So instead of relying on generic numbers, it’s important to understand how solar generation actually works.
In this guide, I’ll walk you through:
- Realistic daily, monthly, and yearly generation
- Why solar output varies across India
- A simple formula to estimate it yourself
- A practical example using real-world data
Let’s break it down step by step.
Quick Summary
If you just want a quick estimate:
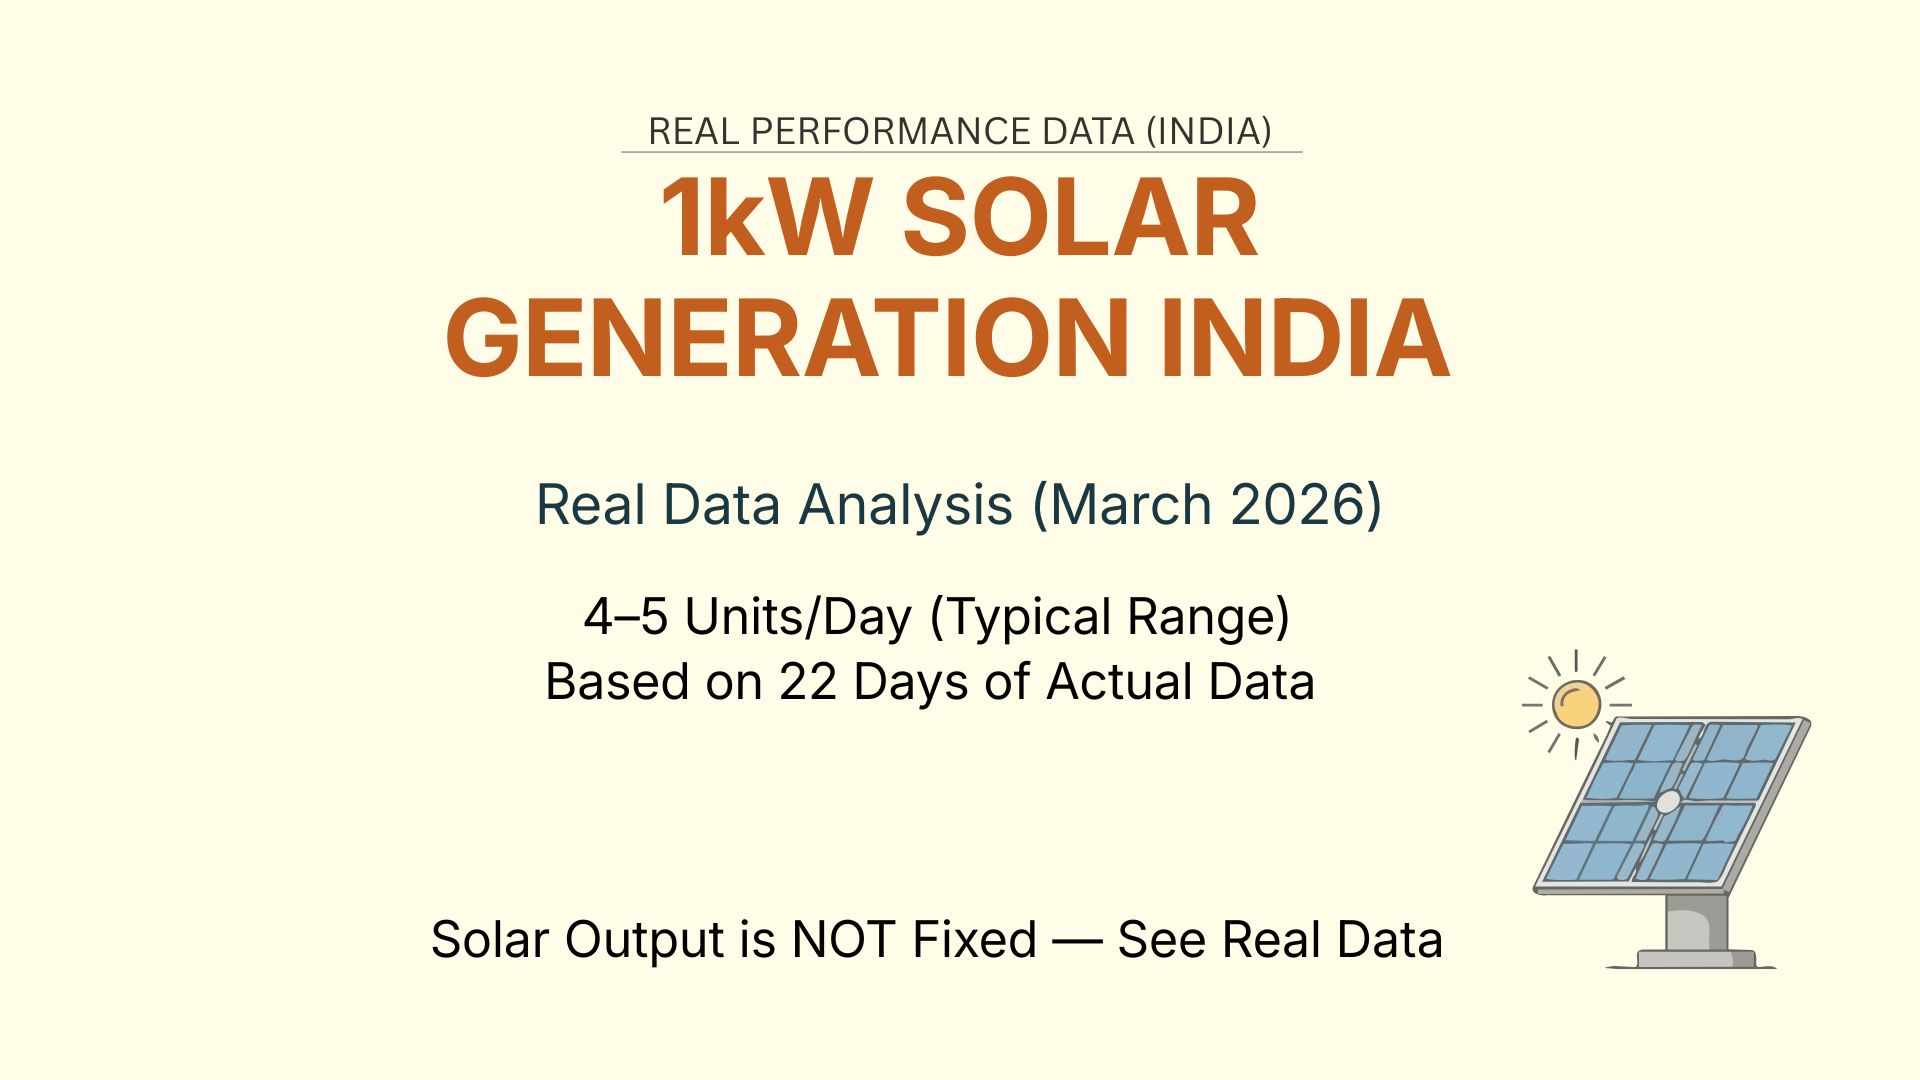
A 1kW solar system in India typically generates:
- Daily: 4 to 5 units
- Monthly: 120 to 150 units
- Yearly: 1400 to 1800 units
But this is just a range.
Your actual generation depends on your location, system design, and efficiency. Let’s understand why.
What Determines Solar Electricity Generation?
A solar system does not produce a fixed number of units every day.
It depends on three key factors. Let’s understand them one by one in a simple way.
Solar Irradiance (PSH – Peak Sun Hours)
Peak Sun Hours means the number of hours in a day when sunlight is strong enough to generate electricity at full capacity. This is the most important factor.
For example:
- Bikaner (Rajasthan): ~5.90 PSH → Higher generation
- Gurugram (Haryana): ~5.33 PSH → Good
- Kozhikode (Kerala): ~5.10 PSH → Moderate
- Kangra (Himachal Pradesh): ~4.86 PSH → Satisfactory
So clearly, more sunlight = more electricity generation. Even within India, this variation can significantly impact your yearly output.
System Efficiency (Performance Ratio – PR)
Performance Ratio (PR) tells us how efficiently your solar system converts sunlight into usable electricity.
No solar system is 100% efficient.
In India, a typical PR is: 0.75 to 0.85. This means 15–25% energy is lost due to:
- High temperature
- Dust on panels
- Wiring losses
- Inverter efficiency
- Shading losses
- Conversion losses

Installation Factors
Even if two homes receive the same sunlight, their output can still differ.
Why?
Because installation matters.
- South-facing panels → higher generation
- Correct tilt angle → better performance
- Shade-free roof → absolutely critical
So, solar generation is not just about panels — it’s a combination of sunlight, system efficiency, and proper installation.
How Much Electricity Does a 1kW Solar System Generate in India? (Formula & Calculation)
Now, let us calculate this practically and realistically.
In theory, a solar system should generate:
Generation = System Size × PSH
But in real life, this is not true.
Why?
Because there are multiple losses in a solar system, as discussed above. All these losses together reduce the output by 15–25%
So, What Do We Do?
Instead of ignoring losses, we include them using something called:
Performance Ratio (PR)
For residential systems, a practical value is:
PR ≈ 0.75 to 0.85
To keep things simple and realistic, we take:
PR = 0.8 (80%)
Final Practical Formula
Now the actual generation becomes: Generation = System Size × PSH × PR
Example: Rajasthan (Real Calculation)
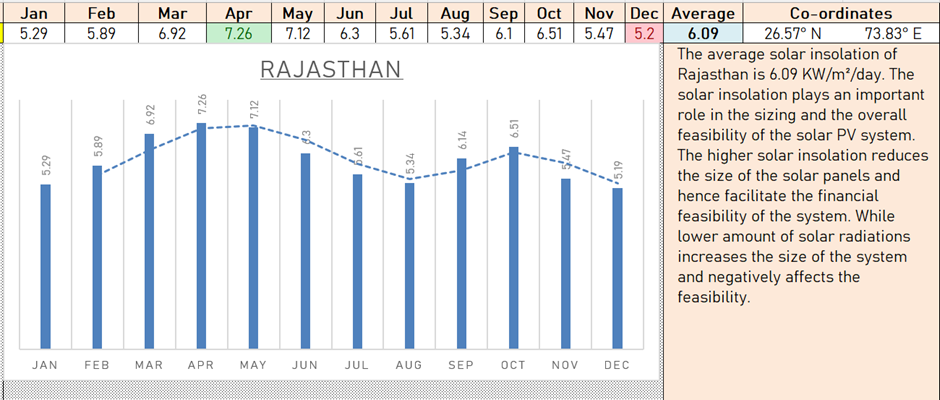
From the data:
- Average PSH in Rajasthan = 6.09
- System size = 1 kW
- PR = 0.8
So,
Energy Generation = 1 × 6.09 × 0.8 = 4.87 units per day
Final Insight
Even though Rajasthan gets more than 6 units of sunlight,
the actual usable electricity is around 4.8–5 units/day because of real-world system losses.
How Location Changes Solar Generation in India
Now, let us understand a very important concept: solar electricity generation changes with location.
Even if you install the same 1 kW solar system, the output will be different in each state.
Why?
Because the PSH (Peak Sun Hours) is different across locations.
Role of Latitude and Location
Solar radiation depends strongly on:
- Latitude (distance from equator)
- Local climate (clouds, humidity, pollution)
This is why two states in India can have different solar output even with the same system size.
State-wise Comparison (1 kW System)
Let us look at real data:
| State | Latitude | Avg. PSH | Daily Units (1 kW) with PR of 80% |
|---|---|---|---|
| Rajasthan | ~26.5° N | 6.09 | ~4.9 units |
| Uttar Pradesh | ~26.8° N | 5.27 | ~4.2 units |
| Maharashtra | ~18.96° N | 5.91 | ~4.7 units |
| Tamil Nadu | ~13.09° N | 5.88 | ~4.7 units |
| Kerala | ~8.5° N | 5.64 | ~4.5 units |
Key Observation
Even though Rajasthan and Uttar Pradesh are at similar latitudes,
their solar generation is different.
- Rajasthan gets much higher PSH (6.09) than UP (PSH: 5.27) because it has an almost dry climate, which keeps the sky clear of clouds and moisture.
Another Important Insight
Maharashtra and Tamil Nadu receive almost similar solar radiation despite being in completely different parts of India.
This shows:
Solar potential is not uniform — it depends on regional conditions.
Final Takeaway
A 1 kW system in India can generate anywhere between 4.2 and 4.9 units per day, depending on your location.
- Monthly → 120–150 units
- Yearly → 1,500 units (average)
This is why a 1 kW system can offset a large part of a small household’s electricity bill. This is exactly why using a fixed number like “4 units per day” is not accurate. To get the real answer, you need to calculate it for your district. Try My Solar Feasibility Spreadsheet
Real Example: My case of a 5kW System
Let me show you the real performance of my 5kW solar. How much does it generate in the last 22 days of March 2026? And finding the everyday performance and finally knowing the average performance in 22 days.
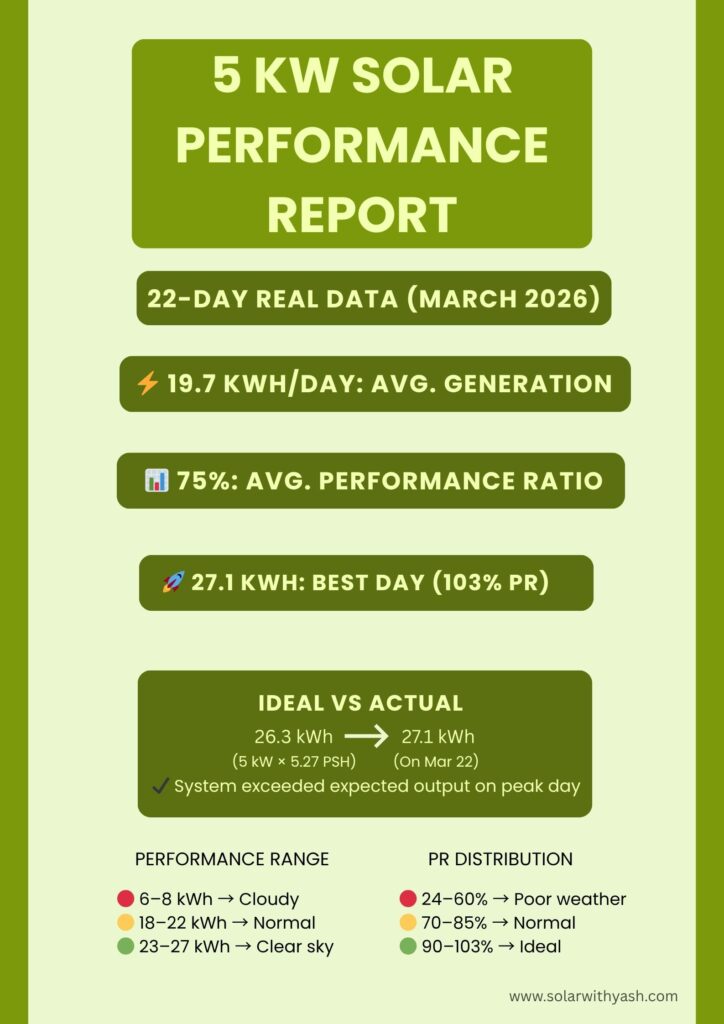
Below is a summary of the key insights before we go into the daily data.
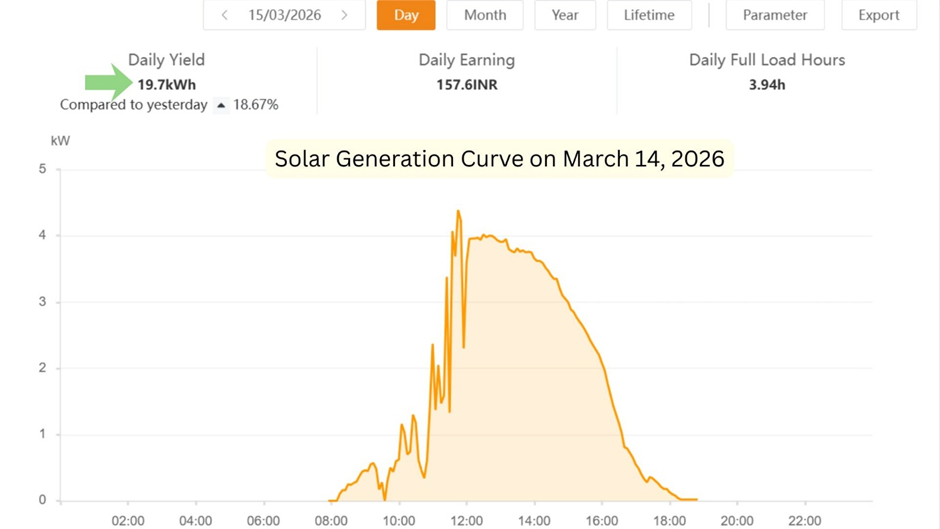
- Average daily generation: 19.7 units per day
- Best day: March 22, 2026 (27.1 units generated)
- Worst day: March 20, 2026 (Only 6.3 units generated)
- Average PR of 22 days: 75%
Week 1: Mar 01 to Mar 07
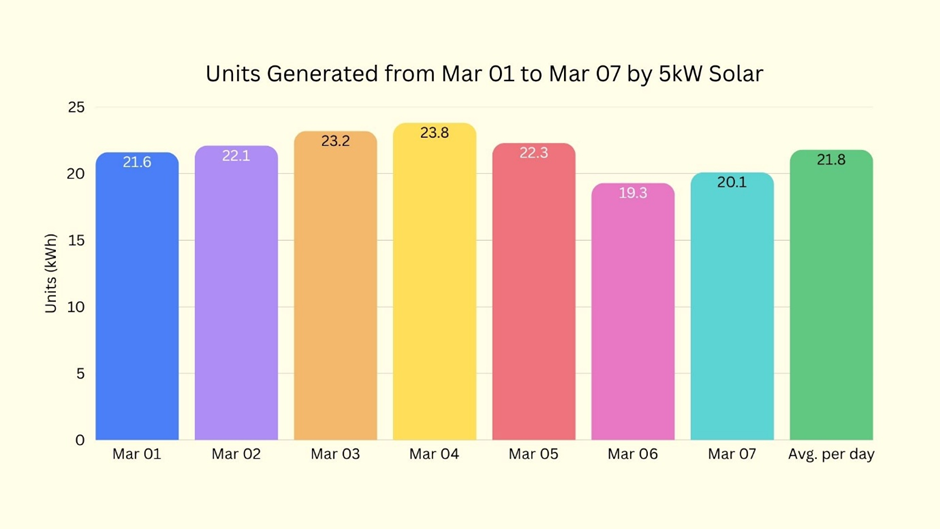
Week 1 Summary (Mar 01 – Mar 07, 2026)
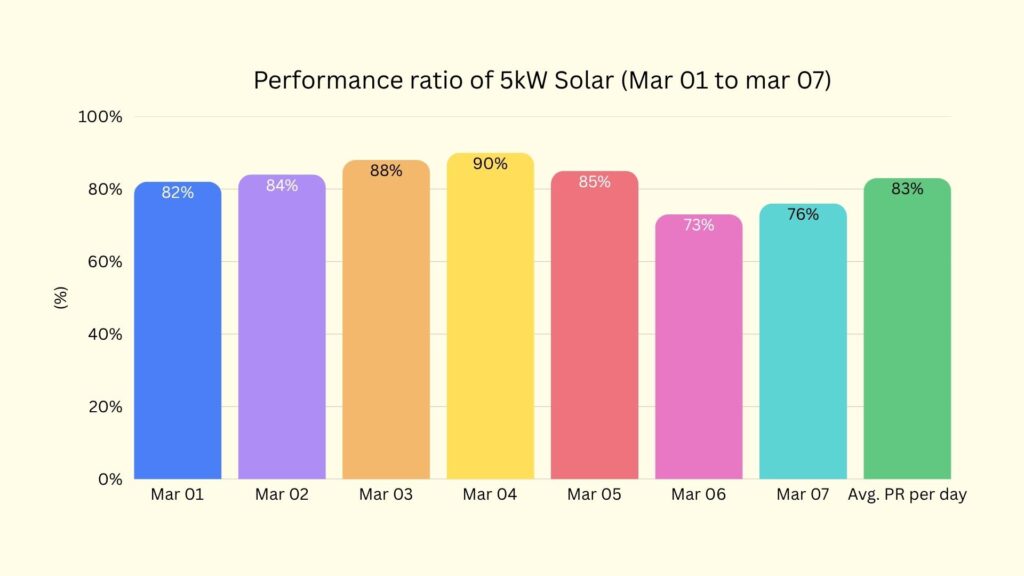
The system delivered stable performance with an average PR of ~83% and average generation of ~21.8 kWh/day.
Peak performance was observed on Mar 04 (90% PR, 23.8 kWh) under clear conditions, while the lowest output on Mar 06 (73% PR) was due to cloudy weather.
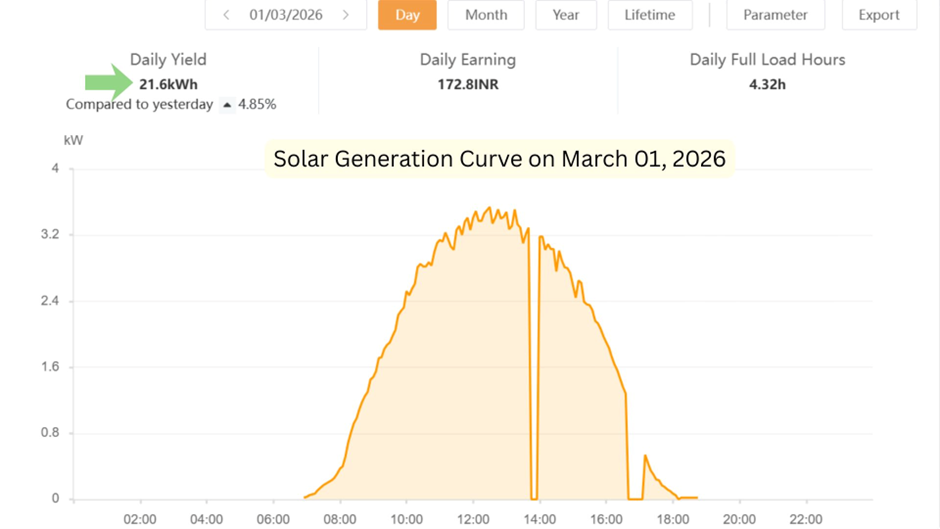
Overall, the system remained within the 80–90% PR range, indicating efficient operation. A brief dip on Mar 01 was observed due to a grid-related issue, not a system fault.
Conclusion: Performance is consistent, with variations driven mainly by weather and minor external factors.
Week 2 (Mar 08 to Mar 14)

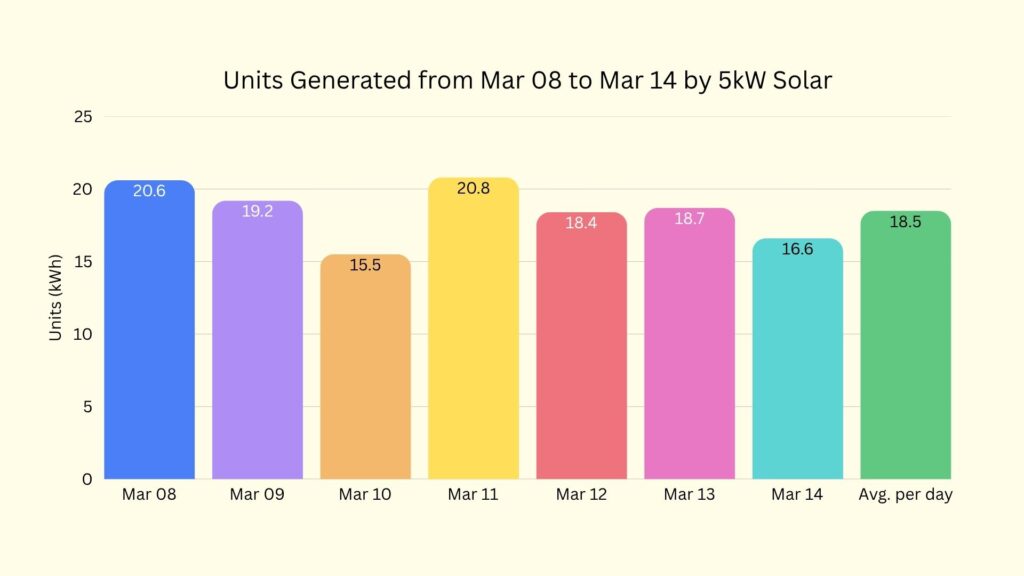
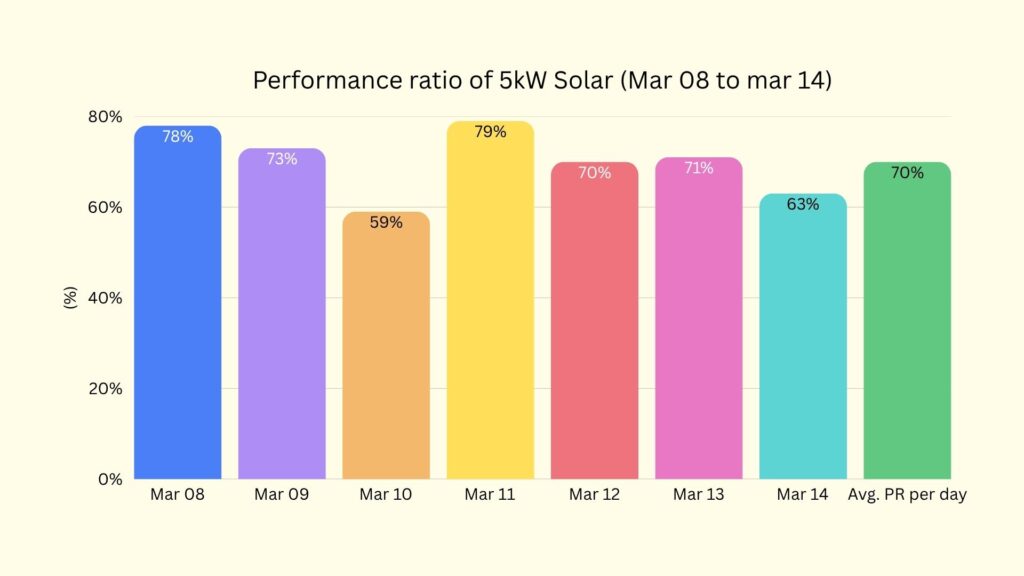
Week 2 Summary (Mar 08 – Mar 14, 2026)
The system showed moderate performance, with an average PR of ~70% and average generation of ~18.5 kWh/day.
Best performance was on Mar 11 (79% PR, 20.8 kWh), while the lowest was on Mar 10 (59% PR, 15.5 kWh), mainly due to cloudy conditions.
Overall, the lower PR compared to Week 1 indicates reduced solar irradiance during the week, not system inefficiency. A brief dip on Mar 08 is again due to a grid-related issue.
Conclusion: Performance drop is weather-driven, with the system continuing to operate normally.
Week 3 (Mar 15 – Mar 22, 2026)
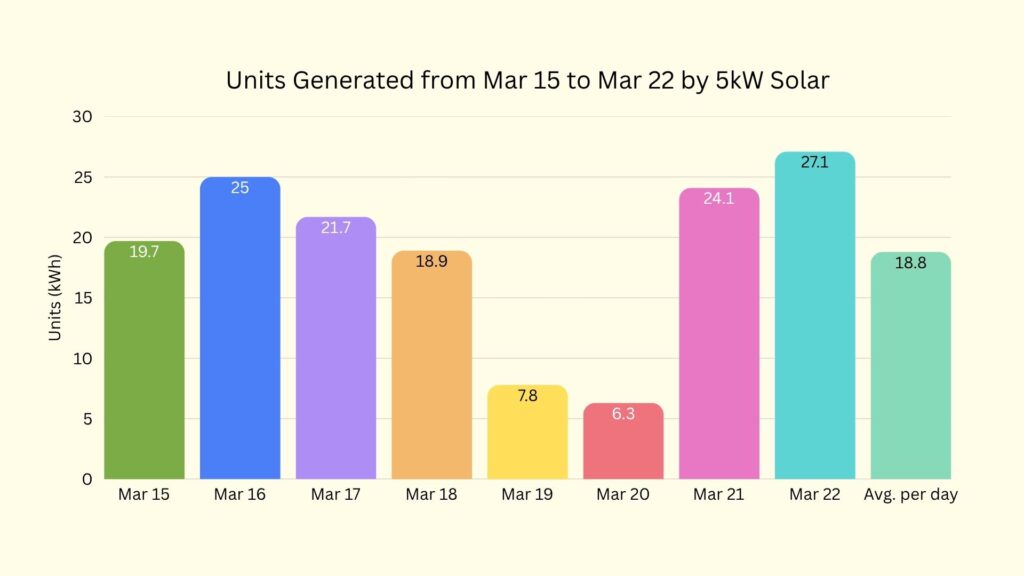
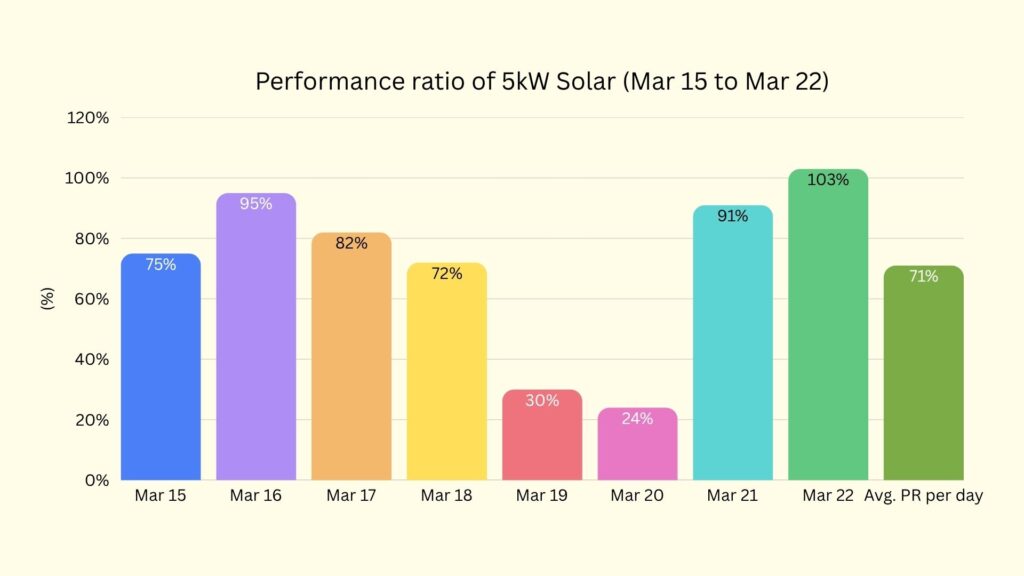
Week 3 Summary (Mar 15 – Mar 22, 2026)
The system showed high variability, with an average PR of ~71% and average generation of ~18.8 kWh/day.
Strong performance was observed on Mar 22 (103% PR, 27.1 kWh) and Mar 16 (95% PR) under clear conditions. Notably, the output on Mar 22 exceeded the typical expected generation (~5 kW × 5.27 PSH ≈ 26.3 kWh), indicating above-ideal performance due to favorable conditions (cool temperatures, high irradiance, or measurement variations).
In contrast, Mar 19–20 recorded very low output (PR 24–30%, 6–8 kWh) due to poor weather conditions. Overall, the fluctuations are weather-driven, not system-related, with quick recovery to high performance once conditions improved.
Conclusion: The system remains efficient, with occasional above-ideal output on excellent days and expected dips during low irradiance periods.
Final Insight of 22 days of solar performance
Final Insights (What This Data Actually Proves)
1. System Performance is Healthy & Reliable
A ~75% average PR over 22 days indicates:
- Efficient system design
- Normal real-world losses
- Stable long-term performance
This is a strong real-world PR benchmark for residential systems in India.
2. Weather is the Biggest Driver (Not the System)
- High PR days (90%–103%) → Clear sky, ideal conditions
- Low PR days (24%–60%) → Cloudy / poor irradiance
Variation is environment-driven, not due to system faults.
3. System Can Exceed “Theoretical Output.”
- On Mar 22, generation reached 27.1 kWh
- Typical expected output: 5 kW × 5.27 PSH ≈ 26.3 kWh
This shows:
- Real systems can outperform estimates
- Due to:
- Lower module temperatures
- High irradiance moments
- Favorable operating conditions
4. ⚠️ Minor Dips Are Normal
- Some dips were due to:
- Grid-related interruptions
- Temporary shading
These are common in real installations and not a concern.
Final Conclusion: Over 22 days, the system has demonstrated consistent, efficient, and realistic performance, with output ranging from low (cloudy days) to even above-ideal levels on excellent days.
If you want to estimate your own system’s exact generation, PR, and payback based on your location, you can use my Solar Feasibility Spreadsheet (SFS).
Biggest Mistakes People Make
The biggest mistake people make is assuming that solar delivers fixed generation everywhere, ignoring real system losses, using incorrect PSH values, and blindly trusting installer promises—where inflated PSH is often shown to make payback look faster. When actual generation falls short, people assume solar is underperforming, but in reality, this gap is driven by a misreading, not by solar itself — solar remains a reliable and profitable investment when calculated correctly.
Before investing ₹2–3 lakh in solar, it makes sense to spend a small amount to calculate it correctly — rather than relying on assumptions or installer estimates.
Conclusion
A 1kW solar system in India does not produce a fixed number of units — and this is the most important takeaway.
From both theoretical calculations and real 22-day performance data, one thing is clear:
Solar generation is dynamic and location-dependent.
In practical terms:
- Most homes will see 4–5 units/day on average
- But real output varies based on PSH, weather, system design, and efficiency
- Even a well-performing system can show daily fluctuations from 60% to 100%+ PR
What truly matters is not chasing a fixed number, but understanding:
✔ Your location’s solar potential
✔ Realistic system losses (PR ~75–85%)
✔ Long-term average performance
The real data from a 5kW system reinforces this:
- Stable average performance (~75% PR)
- Weather-driven variations
- Occasional above-ideal generation under perfect conditions
This proves one critical point: Solar is reliable — but only when calculated correctly.
Final Takeaway for Homeowners
If you are planning solar, don’t rely on generic numbers like “4 units per day.” Instead:
- Calculate your exact generation based on your location
- Use realistic assumptions (PSH + PR)
- Focus on long-term average, not daily fluctuations
Because in solar: Accuracy in calculation = confidence in investment.