Why Two Installers Give Two Different Payback Periods
You decide to go solar and do what any sensible homeowner would do — you call two solar installers.
Both visit the same house. Both see the same roof.
Your monthly electricity usage is the same.
A few days later, the quotations arrive.
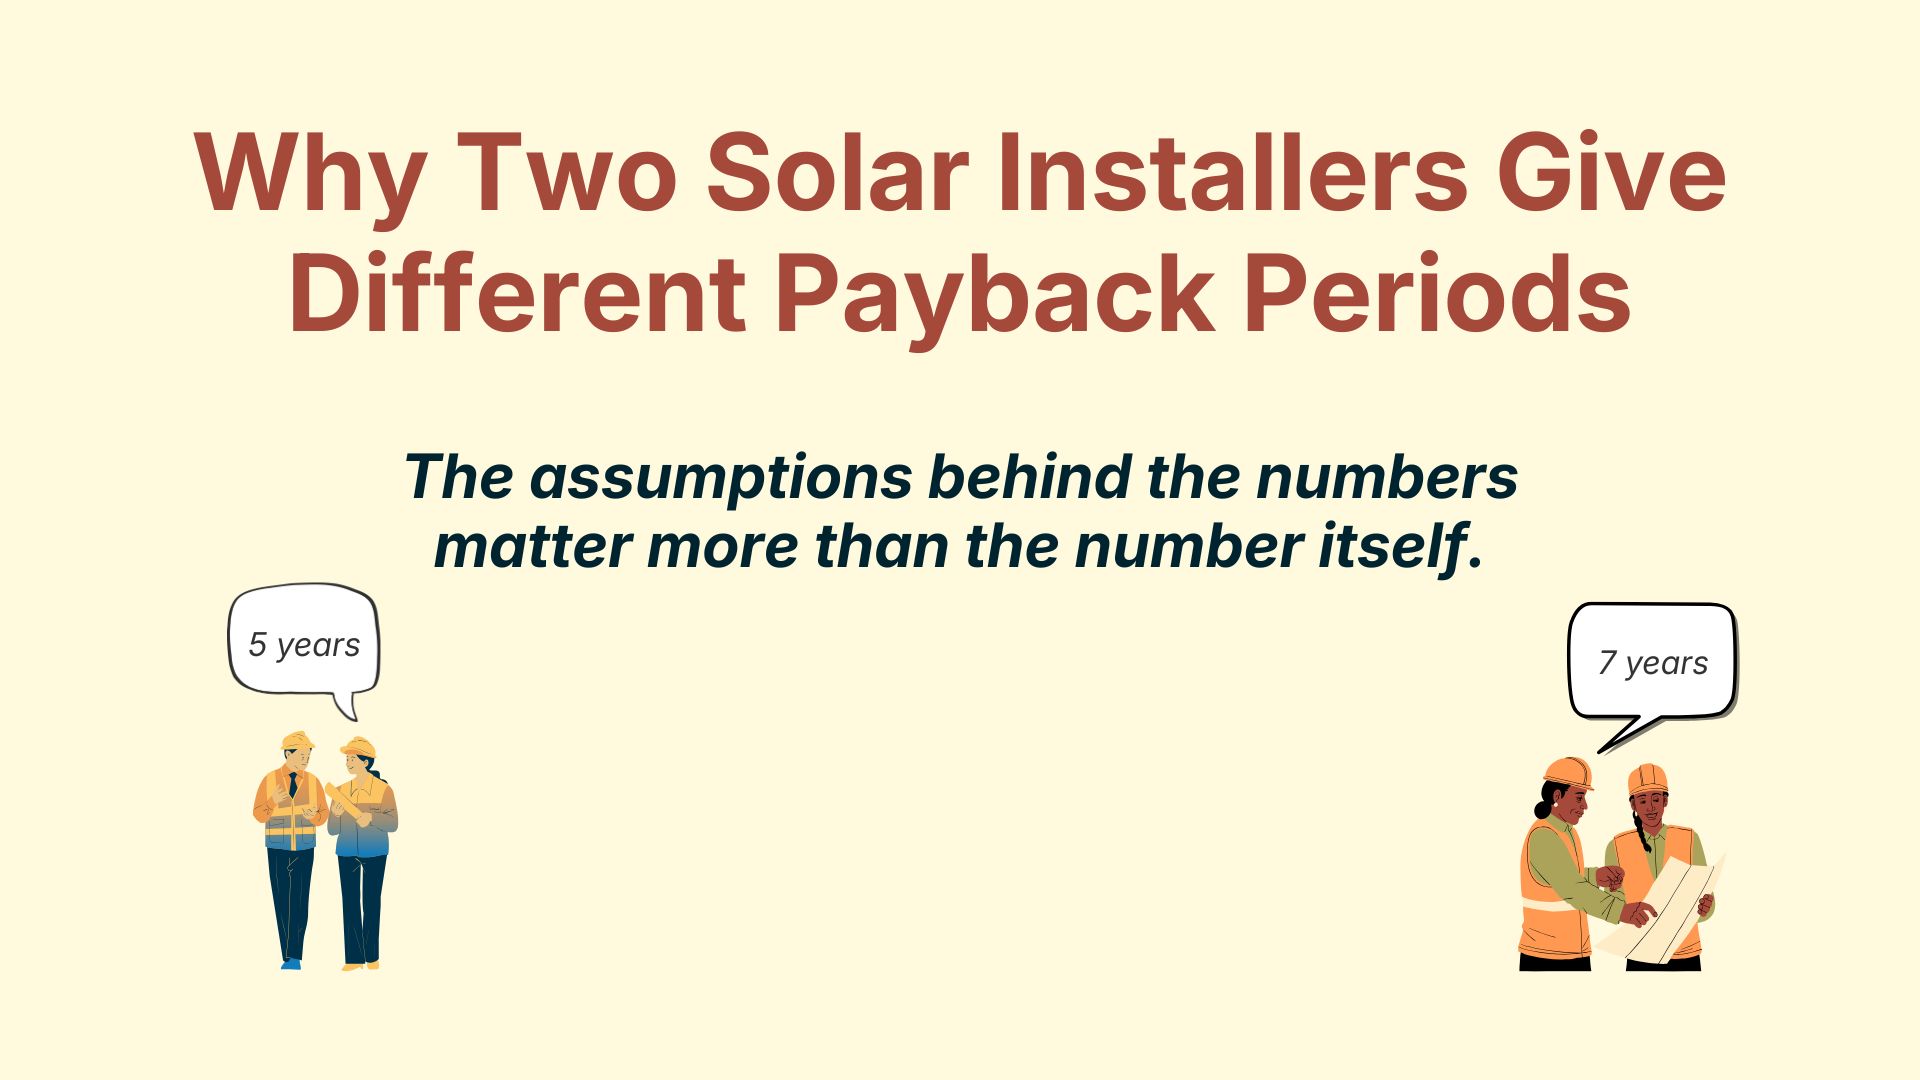
Installer A says your system will recover its cost in 4.8 years.
Installer B says the payback will be closer to 6.3 years.
Now the confusion begins.
You start wondering:
- How can the payback be so different for the same house?
- Is one installer exaggerating?
- Is the other being overly pessimistic?
- Whom should I trust?
This situation is far more common than most people realize. In fact, many homeowners lose confidence in the entire solar decision at this stage — not because solar doesn’t make sense, but because the numbers don’t agree.
Here’s the important part that often gets missed
Different payback numbers do not automatically mean someone is lying.
In most cases, both installers are doing genuine calculations. The difference usually comes from something far less obvious — the assumptions used in the payback calculation.
Solar payback is not a number that comes directly from your roof or your panels. It is an output that depends on multiple inputs: electricity tariffs, usage patterns, export rules, future assumptions, and even how cautiously or optimistically someone chooses to model the future.
When those assumptions differ, payback numbers naturally diverge — sometimes by years.
In this article, we will slowly and clearly unravel this confusion. You’ll learn why two installers can arrive at different payback periods for the same home, and more importantly, how you should compare solar quotes so that the numbers actually make sense to you.
No math overload. No blame. Just clarity.
Payback Is an Output, Not an Input
One of the biggest misunderstandings in solar decision-making is this:
people treat payback as if it is a fixed property of the system — like panel wattage or inverter capacity.
It isn’t.
Payback is not something that is measured. It is something that is calculated. And every calculation starts with assumptions.
You change the inputs (assumptions), and the output (payback) changes automatically.
This is why two installers can look at the same house and still produce different payback numbers.
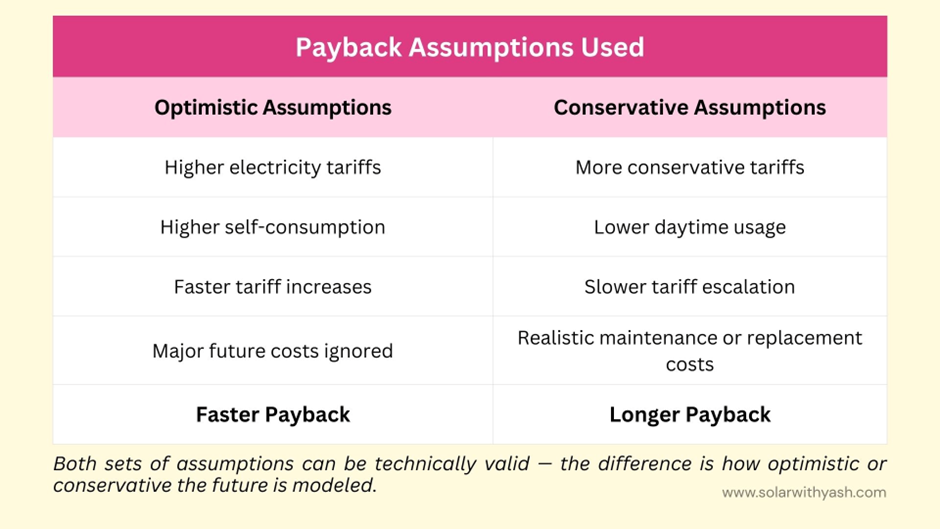
If an installer assumes:
- Higher electricity tariffs
- Higher self-consumption
- Faster tariff increases
- No major future costs
The output will naturally look more optimistic — a shorter payback.
If another installer assumes:
- More conservative tariffs
- Lower daytime usage
- Slower tariff escalation
- Realistic maintenance or replacement costs
The output will appear more conservative — a longer payback. Neither output is “right” or “wrong” by default. Each is simply a reflection of the assumptions behind it.
The important thing to understand is that most of these assumptions do not have fixed values. Electricity tariffs change. Consumption patterns differ from family to family. Solar electricity export rules evolve. Even future price increases are estimates, not certainties.
So, the payback accuracy improves as assumptions become more realistic.
A homeowner who understands this doesn’t ask, “Which payback is lower?”
They ask, “Which assumptions reflect my situation more honestly?”
That awareness is what separates a marketing number from a meaningful one.
The Assumptions Where Installers Commonly Differ
3.1 Electricity Tariff Used
The first place where installers often differ is the electricity tariff they use in the payback calculation. At first glance, the difference may sound minor, but it has a direct and powerful impact on the final payback number.
There are two common ways tariffs are assumed.
Some installers use the highest slab rate shown on your electricity bill. This is usually the last slab you fall into — the most expensive unit of electricity you consume. When this rate is used for the entire solar generation, the calculated savings appear higher.
Other installers take a more conservative approach and use an average tariff, calculated by dividing your total bill amount by the total units consumed. This method automatically includes:
- Lower slabs
- Higher slabs
- Fixed charges
The result is a lower per-unit value — and therefore, a longer payback.
Another important difference lies in fixed charges.
Many optimistic payback calculations ignore fixed charges completely and assume that every unit generated by solar directly replaces a high-cost grid unit. In reality, fixed charges remain payable even after solar is installed. When these are included, the effective savings per unit reduce slightly.
Here’s the key teaching point:
If a higher electricity tariff is assumed, the calculated annual savings will look larger.
If a more realistic tariff is used, the savings estimate becomes more conservative.
Neither approach is inherently dishonest. They simply represent different assumptions.
What matters is awareness.
A homeowner who understands which tariff has been used can immediately judge whether the payback number reflects marketing optimism or real-life billing behavior.
This is why two installers, starting from the same electricity bill, can still arrive at noticeably different payback periods.
Annual Electricity Tariff Escalation Assumed
Another major reason why two installers give very different payback periods is the annual electricity tariff escalation they assume.
In simple terms, tariff escalation means: How much is your electricity price expected to increase every year in the future?
Common assumptions used by installers are:
- 0% escalation (tariff stays flat forever)
- 3% per year
- 5–6% per year
👉 Higher assumed escalation = higher future savings = shorter payback
👉 Lower assumed escalation = lower savings = longer payback
So far, this sounds straightforward. But the real problem lies deeper.
Why This Matters So Much for Payback:
Tariff escalation affects every future year’s savings. Even a small difference matters:
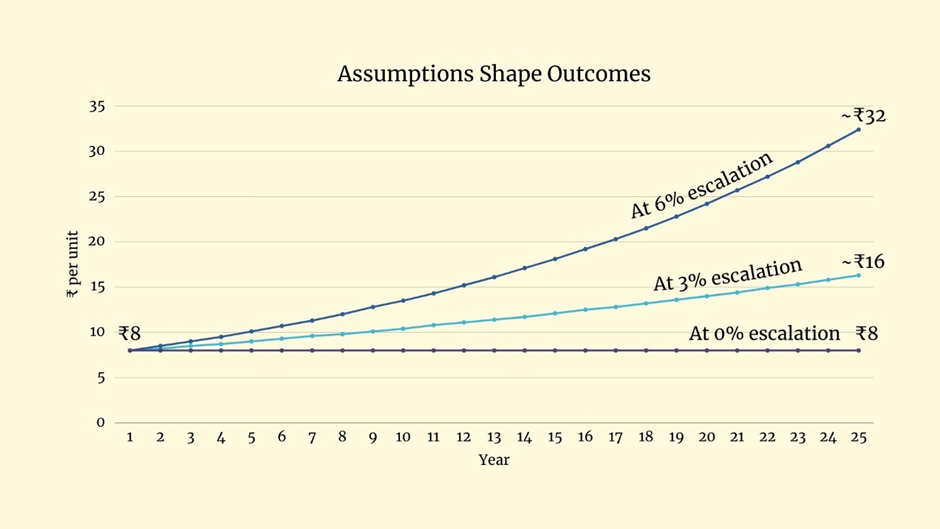
- 3% vs 6% escalation may look small today
- But over 20–25 years, it can change savings by lakhs of rupees
- That directly shifts payback by 2–4 years
This is why escalation assumptions quietly become one of the biggest drivers of payback differences.
And unless these assumptions are clearly disclosed, homeowners end up confused and distrustful.
Key Takeaway: If two installers give you different payback periods, always ask what tariff escalation you assumed. Because payback is not a fixed truth — it is the result of assumptions.
3.3 Self-Consumption Percentage
Another very common reason why two installers give different payback periods is the self-consumption percentage they assume.
Self-consumption simply means: How much of the solar electricity you use directly in your home during solar hours?
Typical assumptions made by installers:
- Optimistic: 60–70% self-consumption
- Conservative: 30–40% self-consumption
👉 Higher self-consumption → shorter payback
👉 Lower self-consumption → longer payback
Most homeowners (and sometimes installers) implicitly assume this: “Whatever units my solar system generates, I save money equal to my average grid electricity rate.”
So, if:
- Solar generates 6,000 units/year
- Average grid rate is ₹8/unit
Then, savings are assumed to be: 6,000 × ₹8 = ₹48,000 per year
This assumption looks logical — but it is not fully correct.
There is a catch.
The Catch: Import Rate Is Usually Higher Than Export Rate.
In most places:
- Import (buying from grid) rate = higher
- Export (selling to grid) rate = lower
So, the value of solar electricity depends on:
- When you use it
- Whether you consume it or export it
That is where the self-consumption percentage becomes critical.
Why Two Families Get Different Paybacks (Even with the Same System)
Let’s take a simple, realistic example.
Assume:
- Import electricity rate = ₹8/unit
- Export rate = ₹6/unit
- Same solar system
- Same location
- Same annual solar generation
Now look at two families.
Family A: High Daytime Usage
- Self-consumes 70% of solar generation
- Exports 30%
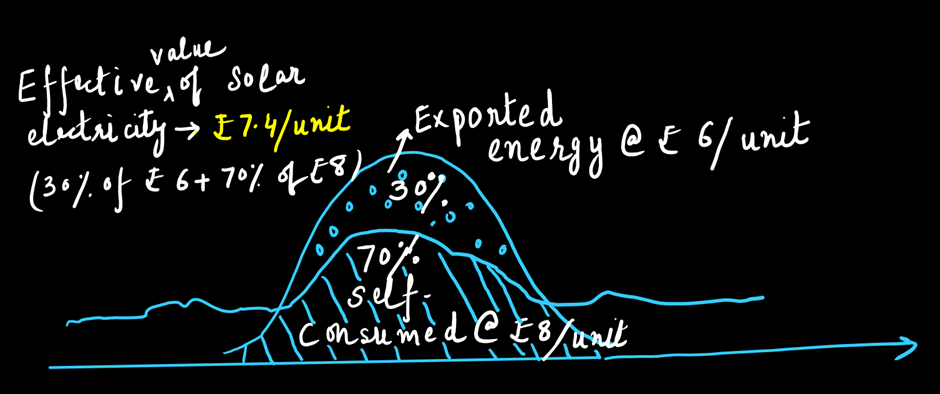
Effective value of solar electricity:
- 70% × ₹8 = ₹5.6
- 30% × ₹6 = ₹1.8
Average effective solar value = ₹7.4/unit
Family B: Low Daytime Usage
- Self-consumes only 30%
- Exports 70%
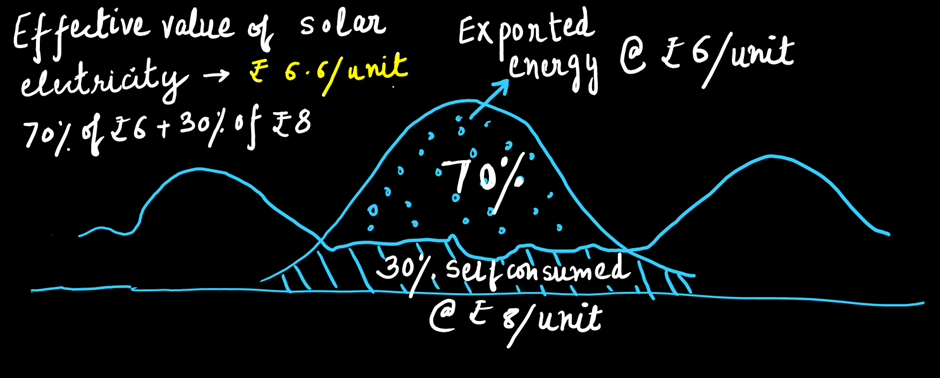
- 30% × ₹8 = ₹2.4
- 70% × ₹6 = ₹4.2
👉 Average effective solar value = ₹6.6/unit
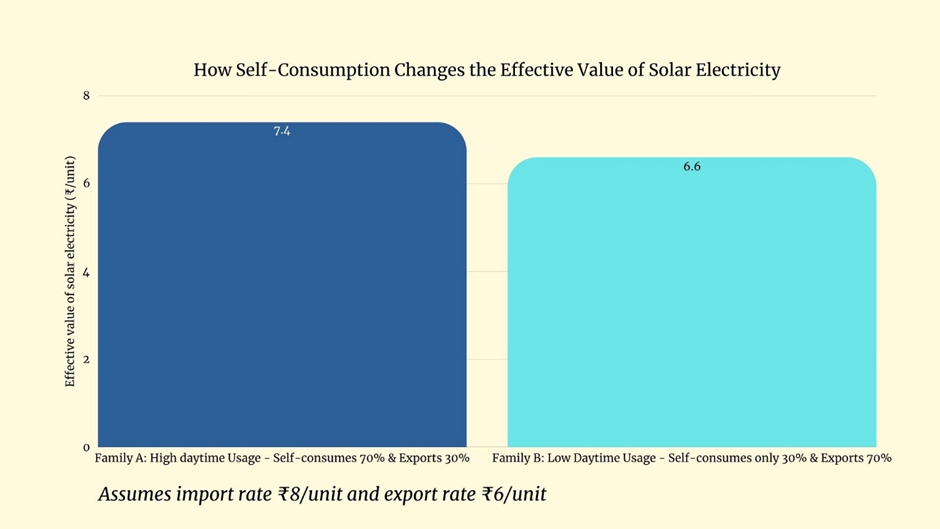
Same System, Same Units — Different Savings
Both families:
- Have the same solar system
- Generate the same number of units
- Pay the same grid tariff
Yet:
- Family A saves at ₹7.4/unit
- Family B saves at ₹6.6/unit
Over 20–25 years, this difference becomes very large, and it directly affects:
- Annual savings
- Payback period
- Lifetime returns
Where Installers Differ
Now you can see the problem clearly.
- An installer assuming 60–70% self-consumption (without studying your usage) will show faster payback
- Another installer assuming 30–40% self-consumption will show slower payback
Neither calculation is “wrong” — but one may not match your reality.
The Core Lesson for Homeowners
Self-consumption is not a guess. It depends on:
- Daytime appliance usage
- Work-from-home vs office
- AC usage timing
- EV charging (if any)
- Water pump and geyser timing
Without understanding this, payback numbers can look attractive — but misleading.
Key Takeaway
If two installers give different payback periods, always ask:
- What self-consumption percentage have you assumed?
- Is it based on my actual usage pattern?
- What import and export rates are you using?
Because solar savings are not just about units generated — they are about when and how those units are used.
3.4 System Degradation Assumed
Another important assumption where installers often differ is system degradation.
Many solar payback calculations implicitly assume that:Solar panels will produce the same number of units every year throughout their life.
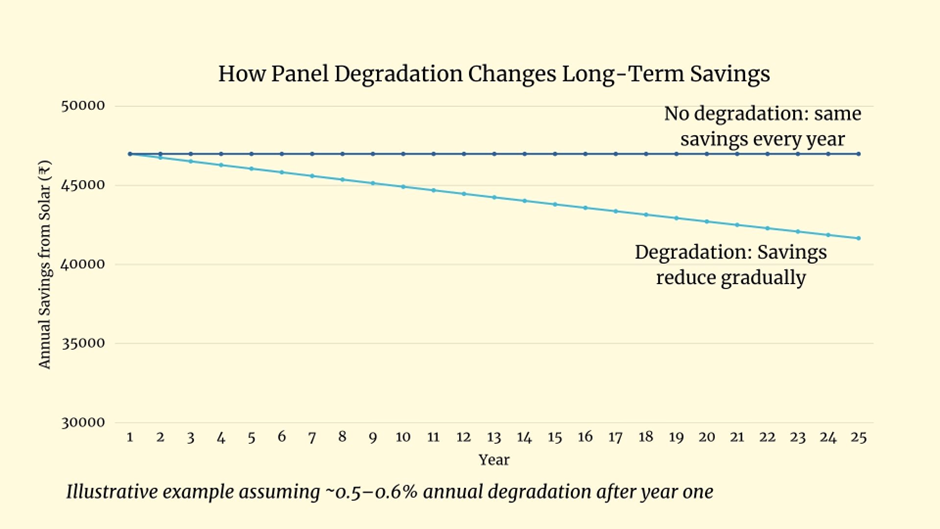
In other words:
- Year 1 generation = Year 10 generation = Year 25 generation
- Same savings every year
This assumption makes payback look faster.
But in reality, this is not how solar panels behave.
The Reality: Solar Panels Do Degrade Over Time
Solar panels are solid-state devices, but they are not immune to aging.
In real-world conditions:
- Panel output reduces gradually over time
- Annual energy generation slowly declines
- As the generation declines, annual savings also reduce
This directly affects:
- Total lifetime savings
- Payback period
- Long-term ROI
What a Realistic Degradation Profile Looks Like
In most modern crystalline silicon panels, degradation typically happens in two stages:
1️⃣Initial degradation (first year):
- Around 2–3% reduction
- Depends on panel technology and manufacturing
- Happens after the panel’s first exposure to sunlight
2️⃣Long-term degradation (after Year 1):
- Around 0.5–0.6% per year
- Gradual and continuous
- Continues throughout the system’s life
So, the system does not produce the same units every year.
Why Ignoring Degradation Changes Payback Let’s understand the impact conceptually.
- If degradation is ignored:
- Every year shows the same savings
- Payback looks shorter
- Lifetime savings look higher
- If degradation is modeled realistically:
- Annual generation slowly reduces
- Savings reduce slightly every year
- Payback shifts later
Over a 20–25-year period, this difference is not small. It can easily change payback by months or even years.
Why Installers End Up with Different Numbers
Some installers:
- Ignore degradation completely
- Or assume “it doesn’t matter much”
Others:
- Use realistic degradation values (0.5–0.8%/year)
- Model declining generation year by year
Same system. Same location.
Different degradation assumptions → different payback periods.
Key Takeaway: When comparing solar payback numbers, always ask:
- Have you assumed any system degradation?
- Is first-year degradation included?
- What annual degradation rate is used?
Because assuming zero degradation makes savings look better on paper — but real systems age, and good feasibility studies account for that.
3.5 Inverter Replacement & O&M
Why one installer includes it — and another doesn’t
Most homeowners are told, “Solar systems last 25 years.”
That statement is partly true. Solar panels can last 25 years.
But Inverters don’t. Panels age slowly. Inverters are electronics.
Solar panels lose output gradually over time.
Inverters are electronic devices — and electronics have a finite life.
In real residential installations:
- A grid-tied inverter typically lasts 10–12 years
- Over a 25-year system life, this usually means:
- At least one inverter replacement
- Sometimes two, depending on heat, usage, and grid quality
That is normal.
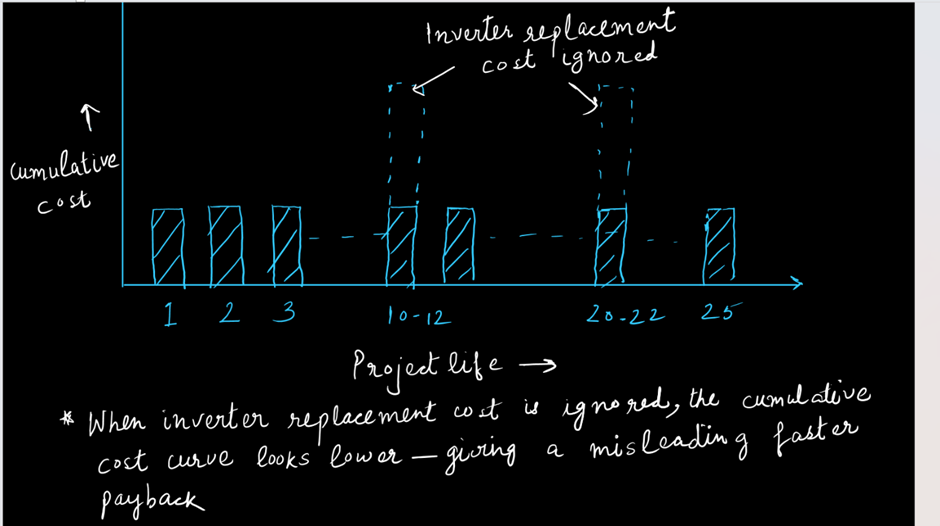
An Example
A simple example (same house, same system). Let’s take a common residential setup:
- System size: 5 kW
- Inverter size: 5 kW
- Inverter cost today: ₹50,000–₹55,000
Over 25 years:
- Initial inverter (included in system cost)
- Replacement around year 10–12
- Possibly another replacement around year 20–22
Total inverter replacement cost over the system life:
- Roughly ₹1,00,000–₹1,10,000
Now comes the key difference.
Installer A: Inverter replacement not included. Some installers calculate payback assuming:
- Panels last 25 years
- Inverter lasts “long enough”
- No major mid-life cost is shown
What happens?
- Annual savings look smooth
- There’s no visible interruption
- Payback looks shorter
Nothing is technically wrong — the model is just optimistic.
Installer B: Inverter replacement included. Another installer assumes:
- Inverter will need replacement every 10–12 years
- Replacement cost is real
- Cost appears as a lump sum, not hidden inside “maintenance”
What happens?
- A visible cost appears during the system life
- Net savings dip when replacement happens
- Payback stretches by a year or two
As a result, different assumptions → different payback numbers.
The takeaway: Before trusting a payback number, ask this: “Does this include inverter replacement — and when?”
If it doesn’t:
- The payback isn’t wrong
- It’s just optimistic
And optimistic assumptions always make payback look better.
This is also why claims like “5-year payback” often fail mathematically. If you’re curious how a single payback number can hide multiple optimistic assumptions, you may find this useful: Why “5-Year Payback” Claims Are Mathematically Misleading.
3.6 System Cost Scope
What is included — and what quietly isn’t
Another reason two installers can give very different payback periods has nothing to do with sunlight, generation, or system performance.
It comes down to a simple but often overlooked question: What exactly is included in the system cost?
Payback is calculated by dividing the system cost by annual savings. So even small differences in assumed cost can noticeably change the final result.
Subsidy: included upfront or treated separately?
Some installers calculate payback assuming the subsidy is already received. They subtract the subsidy from the system cost before running the numbers.
Others calculate payback using the full upfront cost, and treat the subsidy as something that arrives later.
Both approaches can be technically valid.
But they lead to different payback periods.
When the subsidy is deducted upfront:
- The system appears cheaper
- Payback looks shorter
When subsidy is treated separately:
- The initial cost looks higher
- Payback stretches slightly
What else may be missing from “system cost”? System cost is rarely just panels and inverters.
Some proposals include:
- Net metering charges
- Utility approvals and paperwork
- Structural supports or additional cabling
- Taxes and miscellaneous fees
Others don’t. These costs often appear later as:
- “Minor charges”
- “Government formalities”
- “One-time extras”
Individually, they don’t seem significant.
Together, they increase the effective system cost.
And since payback is sensitive to cost, excluding them makes the payback look better on paper.
Why this creates confusion
Homeowners usually see one number:
“Total system cost: ₹X”
They rarely see:
- What is included in that amount
- What is expected to be paid later
- Whether the cost shown is before or after subsidy
So, when two installers give two different payback numbers, it feels like one of them must be wrong.
In reality, the difference often lies in what each installer chose to include.
The core idea
Lower assumed cost always leads to a shorter-looking payback. That doesn’t make the calculation dishonest. It makes it incomplete.
A meaningful payback comparison requires clarity on:
- What you pay upfront
- What you pay later
- And what is already being deducted silently
Once again, two installers can look at the same house and give different numbers — simply because they defined “system cost” differently.
How Homeowners Should Compare Payback Quotes
Once you understand that payback numbers depend on assumptions, the goal is no longer to find the lowest payback — it is to find the most realistic one.
This is where many homeowners go wrong. They compare the final payback number and ignore the assumptions behind it. A better approach is to compare the logic of the calculation, not just the outcome.
Here is a simple checklist that makes payback comparisons meaningful. Ask for Assumptions in Writing
Every installer should be able to explain:
- What electricity tariff they have used
- What annual tariff increase they have assumed
- How much of your solar power they expect you to self-consume
- What export rate have they applied
- What costs are they taking for finding the payback
When assumptions are written down, numbers become transparent. When assumptions are missing, payback figures lose meaning.
A professional installer will never hesitate to share assumptions.
Normalize Tariffs and Export Rates
If one installer uses a high slab tariff and another uses an average tariff, the comparison is no longer fair.
Try to normalize the numbers mentally:
- Are both using the same tariff logic?
- Are both assuming the same export value?
- Are fixed charges treated similarly?
You don’t need to recalculate everything — you just need to check whether the starting point is comparable.
Compare Self-Consumption Logic, Not Just Percentages
Many quotations mention a self-consumption percentage, but few explain why that number was chosen.
Ask:
- Does this percentage match how your household actually uses electricity?
- Is it based on your lifestyle or just a default assumption?
A realistic explanation is far more valuable than an attractive percentage.
Ask for Best, Average, and Worst-Case Payback
A single payback number hides uncertainty.
A much better question to ask is:
- What does payback look like if assumptions are optimistic?
- What does it look like under average conditions?
- What happens if reality is less favorable?
A payback that still makes sense under average or slightly conservative assumptions is far more reliable than one that works only in the best case.
The Core Lesson
Comparing payback quotes is not about finding the shortest number — it is about finding the most honest one. When you focus on assumptions instead of outcomes, confusion reduces, confidence increases, and solar decisions become far clearer.
If you’ve realised that payback depends heavily on assumptions, the next step is not guessing better — it’s testing them.
A transparent tool like the Solar Feasibility Spreadsheet- India Edition and U.S. Edition lets you adjust tariffs, self-consumption, escalation, degradation, and costs openly, so you can see how payback changes instead of relying on a single default number.
The Deeper Lesson About Solar Decisions
After looking at multiple quotations and understanding how payback is calculated, a deeper pattern starts to emerge.
Solar payback is not something that should be treated as a single number.
It is far more realistic to think of it as a range.
This range exists because the future itself is uncertain. Electricity tariffs may rise faster or slower than expected. Export rules can change. Household usage patterns evolve. No calculation, no matter how detailed, can perfectly predict all of this.
This is why strong solar decisions are not based on the best-case scenario.
A good decision is one that still makes sense under conservative assumptions.
If a system looks attractive only when everything goes right — high tariffs, high self-consumption, generous export rates, and no future costs — then the decision is fragile. It depends on optimism holding steady for years.
On the other hand, when a solar system remains financially sensible even after:
- Using average tariffs instead of peak slabs
- Assuming modest self-consumption
- Including realistic degradation and costs
The decision becomes robust.
This leads to an important shift in mindset
Instead of asking, “How fast can I recover my money?” a better question is, “Does this investment still work if reality turns out to be less generous than the brochure?”
That is where transparency matters more than optimism.
Clear assumptions, openly stated, allow homeowners to judge risk and reward honestly. Optimistic numbers may feel reassuring today, but transparent numbers build confidence that lasts for decades.
This is why the most valuable payback estimate is not the shortest one — it is the one that survives scrutiny.
As a guiding principle, remember this:
A realistic payback that holds under conservative assumptions is more valuable than an optimistic one that collapses later.
When solar decisions are made this way, regret is replaced by clarity — and confidence replaces confusion.
If this article made you pause or rethink how solar payback is usually presented, that reaction is intentional. The eBook: Why Solar Payback Calculations Are Wrong is not an extension of this article. It’s a slower, structured guide for homeowners who want to step back from urgency, understand why payback numbers keep changing, and think calmly before committing to a long-term solar decision.
Conclusion – Clarity Replaces Confusion
When two installers give you two different payback periods, it is natural to feel confused and uncertain. But as we’ve seen throughout this article, the difference rarely comes from intent or competence.
It comes from assumptions.
Different installers choose different values for tariffs, self-consumption, export rates, future price increases, and system costs. Once those assumptions change, the calculated payback changes automatically.
So, the equation is simple:
Different installers → different assumptions → different payback numbers.
There is no villain in this process — only variability.
The real problem begins when assumptions are hidden or not discussed at all. That is when numbers start to feel arbitrary, and trust begins to erode. But once assumptions are made visible, the confusion fades quickly.
An informed homeowner does not chase the shortest payback period. Instead, they ask better questions:
- What assumptions were used?
- How realistic are they for my household?
- Would this system still make sense if conditions are less favorable?
This shift in thinking is powerful. It replaces guesswork with understanding and marketing claims with clarity.
Solar decisions last for decades. Taking the time to understand the logic behind the numbers ensures that your decision remains sound long after the installation is complete.
Clarity, not speed, is what ultimately leads to confidence.
FAQ
1. Why do two solar installers give different payback periods for the same house?
Because solar payback is calculated, not measured. Different installers use different assumptions for electricity tariffs, self-consumption, tariff escalation, degradation, and future costs. When assumptions change, payback changes automatically.
2. Does a shorter solar payback mean the quote is better?
Not necessarily. A shorter payback often results from more optimistic assumptions, such as higher tariffs, higher self-consumption, or ignoring inverter replacement. A longer payback may actually be more realistic.
3. Is one installer lying if their payback is much lower?
Usually, no. In most cases, both installers are doing genuine calculations but with different modeling choices. The issue is not honesty — it’s transparency about assumptions.
4. What assumptions affect solar payback the most?
The biggest drivers are:
- Electricity tariff used
- Annual tariff escalation assumed
- Self-consumption percentage
- Export rate
- System degradation
- Inverter replacement and maintenance costs
Even small differences here can change payback by years.
5. Should inverter replacement be included in payback calculations?
For a realistic long-term view, yes. Grid-tied inverters typically last 10–12 years. Ignoring replacement costs makes payback look faster on paper but less accurate over a 25-year system life.
6. How should homeowners compare solar payback quotes correctly?
Instead of comparing final payback numbers, compare the assumptions behind them. Ask installers to clearly explain tariffs, escalation, self-consumption, export rates, and future costs used in their calculations.
7. Is solar payback a fixed number?
No. Solar payback is best understood as a range, not a single number. A payback that still makes sense under conservative assumptions is more reliable than one that works only in the best case.