Why “5-year payback” claims are mathematically misleading
Introduction
In an earlier article, I explained why most solar payback calculations are wrong by 2–3 years due to missing inputs such as incorrect solar irradiance data, ignored maintenance escalation, and unaccounted loan interest. But even if every one of those assumptions is corrected, a deeper problem remains. The widely advertised “5-year payback” is itself a mathematically misleading metric.
This article goes beyond missing costs and faulty assumptions to examine why simple payback, by design, fails to represent the true financial reality of a solar investment — and why relying on it can lead homeowners to make confident but flawed decisions.
Why “5-Year Payback” Sounds So Convincing
The idea of a “5-year payback” sounds attractive mainly because it is simple and easy to remember. One clean number. No confusion. No calculation. It immediately creates clarity in the homeowner’s mind. That is precisely why it works so well as a sales metric, even though it is not a true financial metric.
When someone hears “5-year payback,” a very clear picture is formed subconsciously:
After 5 years, my solar system is paid off. After that, electricity is almost free.
This creates a fixed milestone in the mind — a point in time after which savings magically begin. But in reality, solar savings do not start after payback. They start from day one, and they vary every year. There is no single moment where the system suddenly becomes “free.”
Another reason this number feels convincing is that it creates a sense of certainty. A long-term decision involving 25 years of performance is reduced to a short, confident statement. But financial reality is not fixed like that. Actual savings depend on many variables — electricity usage, tariff changes, system performance, degradation, maintenance, and policy conditions. A single number cannot remain the same for everyone.
A logical question?
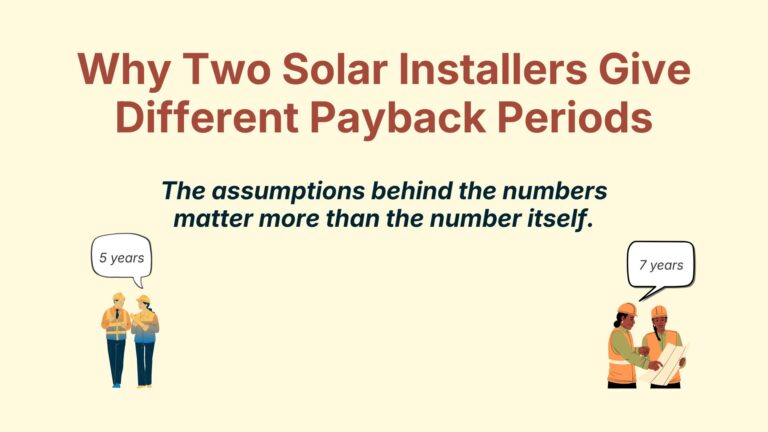
This raises a simple but important question: How can a 5-year payback be identical for two different homes, in two different cities, with different electricity bills and usage patterns?
Yet payback claims are often presented as if they are universal and guaranteed.
The biggest psychological effect of a “5-year payback” claim is that it compresses uncertainty. It removes variation, risk, and change from the picture. It turns a long-term financial asset into something that feels almost like a fixed deposit — predictable, safe, and time-bound.
But solar does not work on fixed milestones. Savings do not switch on after a certain year. They accumulate gradually, and they change over time. That is why “5-year payback” feels reassuring — not because it is financially complete, but because it is mentally comfortable.
What Installers Usually Mean by “Payback”
When installers talk about payback, they usually mean something very simple.
In most cases, payback is calculated like this:
Payback = Total system cost ÷ Annual savings
For example, let us say:
- A 4 kW solar system costs ₹2,20,000
- Expected annual savings are ₹45,000
Then the payback is shown as:₹2,20,000 ÷ ₹45,000 ≈ 5 years

This calculation is not wrong. But it is incomplete. The problem is not the division.
The problem is the assumptions hidden behind it.
The Assumptions
This simple formula quietly assumes that annual savings will remain constant every year for the next 25 years. It assumes that the solar system will perform in the same way in year 1, year 10, and year 20 — which never happens in reality.
It also assumes no degradation of solar panels. In practice, panel output slowly reduces every year. The difference may look small in one year, but over many years it becomes meaningful.
Maintenance costs are also treated as fixed or negligible. In reality, maintenance expenses tend to increase with time, just like any other equipment. Some years may have almost no cost, while other years may involve repairs or component replacement.
Another major assumption is that money has the same value in all years. The formula treats ₹45,000 saved today and ₹45,000 saved after 10 years as equal. In real financial terms, they are not the same. This is the time value of money, which simple payback completely ignores.
Costs also do not increase in a linear, smooth manner. Some expenses come as step-up costs. A common example is inverter replacement, which typically happens around 10–12 years. That cost does not appear gradually — it appears suddenly, over the course of one year.
So, while real solar cash flows are variable and uneven, the payback formula assumes everything behaves linearly and smoothly. In short:
- Reality is variable
- Payback math is straight-line
That gap between reality and assumption is where most payback claims become misleading.
The Core Mathematical Flaw: Ignoring Time Value of Money
The biggest mathematical mistake in most payback calculations is elementary:
₹1 today is not equal to ₹1 after 10 years.
The value of money does not remain the same over time.
Think about something very ordinary. Five years ago, a cup of coffee cost around ₹10. Today, the same cup costs ₹25 or even more. The coffee did not become better — the purchasing power of money reduced. This happens because of inflation.
The same logic applies to solar savings.
If your solar system saves ₹45,000 in the first year, that ₹45,000 has a much higher value than ₹45,000 saved in the 10th year. Even though the number looks the same, its real value is lower in the future.
This difference is called the time value of money. Simple payback calculations completely ignore this. They assume that savings in year 1, year 10, and year 20 are all equal. This turns a long-term financial decision into static arithmetic — basic division that does not change with time.

But solar is a long-term asset, typically running for 25 years. Long-term assets cannot be evaluated using static arithmetic. They need time-based thinking, where future cash flows are treated differently from present ones.
Once the time value of money is considered, future savings are discounted, and the actual break-even point moves forward. A system that appears to have a 5-year payback on paper often takes several more years to truly recover its cost in real-value terms.

This is why many homeowners feel that their actual savings start later than what was promised — not because solar failed, but because the math used to sell it was incomplete.
In short:
- Payback treats money as static
- Reality treats money as time-sensitive
And that difference alone is enough to shift the real payback period by years.
Why Solar Cash Flow Is Not Linear (But Payback Assumes It Is)
Like any other engineering system, a solar power system also suffers from losses over time. Its performance does not remain the same throughout its life.
In the initial years, solar systems usually perform very well. Output is high, breakdowns are rare, and maintenance costs are low. This is the phase most payback calculations quietly assume will continue forever.
But in reality, performance gradually reduces with time.
Solar panels degrade slowly every year. In the very first year itself, there is an initial performance drop due to the LID effect, typically around 2–3%. After that, degradation continues at about 0.5–0.6% per year, all the way up to the 25th year. This reduction may look small on paper, but over the decades, it has a clear impact on total energy generation and savings.
Then comes the inverter.
Most residential inverters do not last 25 years. In practice, inverter replacement is usually required around 10–12 years, and in many cases again around 20 years. These are not gradual costs — they appear suddenly in a single year and directly affect cash flow.
There are also maintenance issues that are rarely discussed at the time of installation:
- Structure tightening or repair
- Roof cracks near mounting foundations
- Waterproofing work after many monsoons
- Cable replacement or re-routing
- Lightning arrestor repainting or replacement due to rust
These are not guaranteed expenses, but they are possible expenses, especially in the later life of the system.
On top of this, solar savings depend on external factors:
- Changes in the electricity tariff
- Changes in household electricity usage
- Net-metering rules or export limits
- Shading that develops over time due to nearby construction or trees
Dynamic vs Static Savings
So, in reality, solar savings are dynamic in nature. They go up, they go down, and they change shape over time.
But simple payback assumes something very different.
It assumes:
- Same savings every year
- No sudden costs
- No performance drop
- No external changes
In other words, payback assumes a straight line, while real solar cash flow looks more like a curve with bumps.

This mismatch between real-world behaviour and linear math is one of the main reasons why payback timelines fail to match experience. “Now comes a more serious problem. It is not that installers don’t know costs and performance change over time — it is that only some changes are included in the calculation.”
The Selective Math Problem (Escalation Bias)
There is another important issue with payback calculations, and this one is not about a lack of knowledge. Most professionals understand that costs and performance change over the life of a solar project. The real issue is what gets included in the calculation and what gets left out.
In most payback estimates, electricity tariff escalation is included. Future savings are increased year after year to reflect rising grid prices. This makes solar look more valuable in the future, which is reasonable, because tariffs do increase.
But at the same time, future expenses are kept constant or ignored.
For example, suppose a solar system saves ₹45,000 in the first year. With a modest tariff escalation, this saving may be shown as ₹60,000 or more in later years. But during the same period, maintenance costs are often assumed to remain flat, inverter replacement is excluded, and panel degradation is ignored.
So, the calculation quietly assumes:
- Savings go up every year
- Expenses stay the same
- System output never reduces

This creates an imbalance.
The Right Balance
In reality, if savings increase due to tariff escalation, costs also increase with time. Maintenance becomes slightly more expensive, occasional repairs are needed, and at some point, the inverter has to be replaced. Panel output also slowly reduces year after year.
By allowing only savings to grow while keeping expenses fixed, the math starts favouring a shorter payback automatically. The system appears to recover its cost faster — not because the project is better, but because only one side of the equation is allowed to move.
It is important to note that this does not mean anyone is intentionally misleading homeowners. The issue lies in the structure of the calculation. When positive factors are escalated and negative factors are frozen, the result is biased math, not neutral math.
In reality, both savings and expenses evolve together. Ignoring this balance makes payback timelines look clean and confident on paper, but less reliable when experienced over the full life of the solar system.
Why Loan-Based Solar Breaks Payback Logic Entirely
Payback calculations become even more misleading when a solar system is installed using a loan.
In a loan-based system, money starts going out immediately. The EMI begins from the first month, while solar savings build slowly over time. This alone changes the financial behaviour of the project, but simple payback calculations do not account for it.
Let us take a simple example.
Suppose a homeowner installs a solar system costing ₹2,00,000, financed through a loan. The monthly EMI comes to around ₹4,500, which means an annual outflow of about ₹54,000. The system generates savings of roughly ₹45,000 per year.
On paper, installers may still say:
“Your payback is around 4–5 years.”
But look at what is actually happening.
Every year, the homeowner is paying more through EMI than what is being saved on the electricity bill. The cash flow is negative. Even though solar is producing energy, money is still going out of the pocket.
In such a situation, the idea of “payback” loses its meaning. Payback assumes that savings are accumulating and moving towards recovering the initial cost. But when cash flow is negative or flat in the early years, there is nothing accumulating.
The situation improves later, once the loan is repaid. Only after EMIs stop do net savings start becoming clearly positive. But simple payback calculations usually ignore this entire phase and jump straight to a clean payback number.
Why Simple Payback Fails for Loan-Based Solar Systems
So, the question becomes: How can a system be said to have ‘paid back’ when money was still going out every year?
This is why loan-based solar cannot be evaluated using simple payback logic. The timing of cash flows matters. When payments and savings do not align in time, reducing the project to a single “payback year” hides the real financial experience of the homeowner.
In loan-based installations, what matters more is:
- Year-by-year cash flow
- EMI versus savings comparison
- Affordability during the loan period
Without this, payback becomes a number that looks good on paper but does not reflect lived reality.
If cash flow is negative, payback loses its meaning.
Is Discounted Payback the Solution? (Partially — But Not Fully)
A more refined version of payback does exist. It is called discounted payback, and it corrects one major flaw of simple payback — the time value of money.
Unlike simple payback, discounted payback recognises that future savings are worth less than present savings. It reduces the value of cash flows that occur many years later and compares everything in today’s value. From a mathematical point of view, this is clearly better than treating all savings as equal.
Let us understand this with a simple idea.
Suppose a solar system saves ₹45,000 in the first year. Simple payback treats ₹45,000 saved in year 1 and ₹45,000 saved in year 10 as exactly the same. Discounted payback does not. It recognises that the saving in year 10 has lower real value, because prices rise and money loses purchasing power over time.
Once this adjustment is applied, something interesting happens. A system that appears to have a 5-year payback under simple math may actually take 6 or even 7 years to recover its cost in real-value terms.
So yes, discounted payback is mathematically superior to simple payback.
Still picture is not complete
But the problem does not end there.
Even discounted payback still focuses on a single break-even point. It answers only one question:
“When does the system recover its cost?”
It does not tell you:
- How much money the system makes after payback
- How good or bad the cash flow is in different years
- How sensitive the outcome is to changes in assumptions
- Whether the project is strong or fragile over 25 years
Solar is a 25-year asset, not a short-term purchase. Reducing such a long-life system to one “payback year, even after discounting, still hides most of the financial story.
So discounted payback improves the math, but it does not complete the picture.
That is why discounted payback should be seen as a bridge — a step away from oversimplified sales math — but not as the final decision-making tool for a long-term solar investment.
What Homeowners Should Look at Instead of a Single Payback Number
Instead of relying on one “payback year”, homeowners should look at how money actually moves year by year. Solar is a long-term system, and long-term decisions cannot be reduced to a single number.
Net cash flows till the life of the project
The first and most important thing to look at is year-by-year net cash flow.
This simply means:
- How much you save on electricity each year
- Minus all costs in that year — maintenance, inverter replacement, repairs, and any loan EMI
For example, a solar system may save ₹45,000 in the first year, but after accounting for maintenance, insurance, or EMI, the net benefit might be much lower — or even negative in loan-based systems. In later years, when EMIs stop but maintenance increases or inverter replacement occurs, the cash flow changes again.
Seeing this year by year gives a real picture, not a promotional one.
Discounted Break-even Year
The second thing to look at is the discounted break-even year. This tells you when the system actually recovers its cost in today’s value, not just on paper. This number is usually later than the simple payback, but it is far more honest.
Life Time Savings
Next comes lifetime net savings.
Instead of asking:
“When does my system pay back?”
A better question is:
“How much money will I realistically save over 25 years?”
Two systems can have similar payback periods but very different lifetime savings. One may save ₹10–12 lakh over its life, while another may save much less — even if both claim a “5-year payback”.
IRR or ROI
Another useful indicator is the direction of ROI or IRR, not the exact percentage. You do not need complex formulas. What matters is whether returns remain healthy under realistic conditions, or whether they collapse when assumptions change slightly.
Finally, homeowners should always look at best-case and worst-case scenarios.
For example:
- Best case: higher-than-expected tariff increase, stable net-metering, lower maintenance
- Worst case: slower tariff growth, inverter replacement earlier than expected, export limits
If a project still remains financially sensible in the worst case, it is resilient. If it only looks good in the best case, it is fragile. This is the right way to evaluate solar — not by chasing a perfect payback number, but by understanding the range of outcomes.

How to Read Payback Claims Without Getting Misled
Payback claims are not useless — but they must be read carefully. A homeowner does not need to reject a “5-year payback” claim outright, but should always ask a few simple follow-up questions before trusting it.
The first thing to ask is: “What assumptions are you using to calculate this payback?”
For example, if someone says a system has a 5-year payback, ask whether that number includes:
- Panel degradation
- Inverter replacement
- Maintenance escalation
- Loan interest (if applicable)
If the answer is unclear or vague, the number is likely optimistic.
The second question should be: “Is this a simple payback or a discounted payback?”
If the answer is “simple”, understand that it ignores the time value of money. It may still be useful for rough comparison, but it should not be treated as a guarantee.
Another important question is: “What happens to cash flow in the early years?”
For instance, if EMIs are higher than annual savings in the first few years, the system may technically have a “payback”, but the homeowner will still feel financial pressure during that period. A good analysis should show year-by-year cash flow, not just a final number.
Homeowners should also watch for red flags in payback promises:
- The same payback quoted for every customer
- Very aggressive tariff escalation with zero maintenance cost
- No mention of inverter replacement over 25 years
- Claims like “free electricity after payback.”
These do not mean the system is bad — they mean the calculation is oversimplified.
So, when is payback actually useful?
Payback can be helpful as a quick comparison tool — for example, to compare two system sizes under similar assumptions. But it should never be the only decision metric, especially for loan-based or long-term investments.
The right way to read a payback claim is not to accept the number, but to understand the story behind the number.
If the story makes sense, the project is likely sound. If the story is missing, the number alone is not enough.
Final Takeaway: Payback Is a Shortcut — Not the Truth
Payback is not wrong. It is just incomplete.
It reduces a long-term, 25-year solar investment into a single number that feels certain and comfortable. That shortcut may be useful for quick conversations, but it is not strong enough to support a real financial decision.
When important factors like time value of money, system degradation, maintenance, replacements, loan cash flows, and uncertainty are ignored, the math starts looking confident — but the confidence is misleading. And incomplete math often leads to confident mistakes.
Solar is a powerful investment when evaluated properly. The problem is not solar. The problem is how solar is often explained using oversimplified numbers.
That is why a better approach is to look at full cash flows, not just payback. To see how savings and costs change year by year. To understand best-case and worst-case outcomes. And to make decisions based on resilience, not optimism.
This is the thinking behind tools like SFS India and SFS US — not to promise perfect outcomes, but to show realistic ones. To move away from sales numbers and towards decision numbers.
When homeowners understand the complete financial picture, solar becomes not just attractive but trustworthy.
And that is where good solar decisions begin.
Frequently Asked Questions
1. Is a “5-year payback” wrong?
No. It is incomplete. It reduces a 25-year investment into one number and ignores how savings and costs change over time.
2. Why does simple payback feel convincing?
Because one number feels clear and certain, even though real solar savings vary every year.
3. What does simple payback assume?
It assumes:
- Same savings every year
- No panel degradation
- No major future costs
- Money has the same value in all years
These rarely hold true in reality.
4. Why does time value of money matter?
₹45,000 saved today is worth more than ₹45,000 saved after 10 years. Simple payback treats them as equal.
5. Why isn’t solar cash flow linear?
Because performance drops, inverters need replacement, maintenance is uneven, and tariffs and policies change.
6. What is escalation bias?
When savings are increased every year, but expenses are kept flat or ignored, making payback look shorter on paper.
7. Does payback work for loan-based solar?
Often no. If EMIs exceed savings, early cash flow can be negative, making “payback” meaningless.
8. Is discounted payback better?
Yes, it is more honest, but it still shows only one break-even year, not full lifetime performance.
9. What should homeowners look at instead?
Year-by-year cash flow, discounted break-even, lifetime savings, ROI direction, and best vs worst-case outcomes.
10. What is the right way to judge solar?
By resilience, not optimism. If solar works even in conservative scenarios, it is a good decision.
🔗 Free tool: Download my Solar Snap tool to quickly estimate solar potential at your home