Hidden Solar Costs That Increase Payback Period (And How to Reduce Them)
Introduction
Solar power is attractive. It is reliable, clean, and helps homeowners significantly reduce their electricity bills. Because of this, many installers confidently quote a payback period of 5–6 years.
However, in reality, the payback mentioned by installers is often optimistic.
A rooftop solar power system is not a one-time expense that runs flawlessly for 25 years without any additional cost. Certain costs are not highlighted at the time of installation, but they emerge gradually once the system is actually in use. Individually, these costs may look small, but together, they delay the actual payback period of your solar investment.
To understand this better, think of solar like a rental property.
The purchase price alone does not determine profitability. Maintenance, repairs, repainting, and occasional upgrades over the years determine when you truly recover your investment. Solar works in a very similar way — while the savings are steady and predictable, the ownership-related costs decide the real payback period.
These hidden costs usually do not appear in the first few months. They surface over time, and this is where the gap between advertised payback and actual payback begins.
Therefore, if you want to know the real payback period and true ROI of your rooftop solar power system, it is essential to account for these costs before going solar, not after.
In this post, we will discuss all the hidden costs that can increase the solar payback period, so that you can:
- set realistic expectations,
- make a well-informed decision, and
- evaluate solar as a long-term investment, not just a quick savings option.
Only after considering these factors can you calculate the true return on investment (ROI) of your solar power system.
So, let’s begin.
Annual Maintenance & Cleaning
Most solar installers include free maintenance for the first year as part of the installation package. However, after the first year, regular maintenance is either covered under a paid AMC or handled directly by the homeowner.
In reality, even during the first year, many homeowners are required to do regular panel cleaning themselves or arrange it separately. Cleaning may look simple, but it involves time, effort, and sometimes additional cost, especially for rooftop systems in urban areas.
This maintenance aspect has a dual impact on solar payback:
(i) Direct Impact Cost
Solar is not a zero-maintenance system. Over its 25-year life, money is spent on:
- periodic cleaning
- inspection and fault detection
- tightening loose DC/AC connections
- minor electrical repairs
- inverter and monitoring checks
(ii) Indirect Performance Impact
Dust accumulation, if not cleaned on time, can reduce system output. Lower generation directly means lower electricity savings, which further delays the payback period.
For a typical grid-tied rooftop solar system, the average annual maintenance cost typically amounts to 1–2% of the initial system cost.
For example, a 5kW residential solar system costing around ₹2,40,000 after subsidy (in Uttar Pradesh) may incur an average annual maintenance expense of approximately ₹2,500–₹4,000 per year. This includes routine cleaning, minor troubleshooting, tightening loose connections, and small repairs. In the first few years, maintenance primarily involves panel cleaning. As the system ages, repair-related costs slowly begin to appear. Therefore, this percentage represents an average over the entire life of the system, not a fixed yearly expense.

Ignoring this cost may not look significant in the short term, but over 25 years, it becomes a real factor affecting solar payback and ROI.
Payback Impact:
Even a modest annual maintenance cost of 1–2% can increase the payback period by 0.3–0.7 years, especially when combined with performance loss due to delayed cleaning.
Inverter Replacement
Most solar inverters come with a long warranty of 10–15 years, which gives homeowners a sense of comfort at the time of installation. However, what is often not discussed clearly is that the inverter will almost certainly need replacement once during the lifetime of the solar power system.
Unlike solar panels, which typically last 25 years or more, the inverter is an electronic device exposed to:
- high temperatures,
- voltage fluctuations,
- dust and moisture.
Because of this, inverter replacement becomes the costliest hidden expense in a rooftop solar system.
For a typical 5 kW grid-tied solar system, the cost of a new inverter generally falls in the range of ₹50,000–₹55,000, depending on:
- single-phase or three-phase,
- brand and features.

Even after accounting for the scrap value of the old inverter, this expense remains significant.
In practical terms, inverter replacement alone accounts for around 20–25% of the initial system cost.
For example, in my own case:
- 5 kW solar system cost (post subsidy): ₹2,40,000
- 5 kW three-phase inverter cost: ₹55,000
- Inverter cost as a percentage of system cost: ~23%
If this one-time inverter replacement cost is spread over the 25-year life of the solar power system, it effectively adds an average of ₹2,000–₹2,500 per year.
While this cost is not paid every year, its impact on savings is very real. When ignored during payback calculation, the payback period appears shorter than it actually is.
Impact on Payback Period
An inverter replacement expense of this magnitude can delay the solar payback period by 0.8–1.5 years, depending on:
- annual electricity savings,
- tariff growth,
- system performance.
This is why inverter replacement should always be treated as a lifecycle cost, not an unexpected expense.
Solar Panel Degradation (Lower Output Over Time)
The electricity output of a solar panel does not remain constant throughout its life. Instead, it gradually decreases year after year. This means that the solar savings you see in the first few years will not be the same in later years, even if we assume the grid electricity tariff remains constant.

However, when installers quote the payback period of a solar power system, this gradual reduction in output is rarely accounted for. The payback calculation is typically based on the first-year generation, which can make the payback period appear shorter than it actually is.
The rate of degradation depends on:
- panel quality,
- manufacturing process,
- cell technology.
In general:
- n-type and half-cut mono PERC panels degrade more slowly,
- Older polycrystalline and standard p-type panels degrade faster.
Over 25 years, most solar panels deliver only about 85–88% of their original output by the final year. This degradation is gradual — small in the early years, and more noticeable as the system ages.
How Degradation Affects Your Savings (Example)
Let us take a simple example.
| Parameter | Value |
|---|---|
| Location | Ghaziabad |
| Rooftop Solar System Size | 5 kW |
| Grid Electricity Tariff | ₹8 per unit |
| First-Year Net Generation (after losses) | ~20 units per day |
| Daily Generation After ~10 Years | ~17–18 units per day |
| Output Reduction by 25th Year | ~10–15% |
| Primary Reason | Panel degradation over time |
As degradation sets in:
- By around 10 years, daily generation may drop to 17–18 units
- By the 25th year, output may reduce by 10–15% overall
This straight reduction in energy generation means lower annual savings, even though the system is functioning normally.
Lower savings directly translate to a longer payback period.
Technology Matters: n-Type vs p-Type Panels
Panel technology plays an important role here.
- p-type panels suffer from Light Induced Degradation (LID) in the initial years.
- n-type panels are largely immune to LID and therefore show lower early-year degradation.
This is one reason why premium panels often look expensive upfront, but perform better when evaluated over the entire system life.
Payback Impact
Ignoring panel degradation can increase the actual payback period by 0.5–1 year, depending on:
- system size,
- local solar resource,
- electricity tariff.
This impact is small when seen year-to-year, but significant when accumulated over a decade or more.
Key Takeaway
Solar panels slowly produce less electricity every year. If degradation is ignored, the payback calculation becomes over-optimistic.
A realistic solar evaluation must always consider panel degradation, not just first-year generation.
Shadow Growth Over Time
At the time of installation, a rooftop solar system is usually designed for a shadow-free roof. The installer checks shading conditions and ensures that the panels receive adequate sunlight from morning to evening.
However, solar panels are installed for a very long period — typically 25 to 30 years. Over such a long timeframe, it is not realistic to assume that the surrounding environment will remain unchanged.
During the life of the solar system, new obstructions can appear, such as:
- trees growing taller over the years,
- new buildings or high-rise apartments constructed nearby,
- extensions or additional floors added to neighboring houses.
Any of these developments can interfere with the sun path and start casting shadows on the solar panels — even if the roof was completely shadow-free on the day of installation.
Why Shadowing Is a Serious Issue
Solar panels are susceptible to partial shading. Even a small shadow on one section of a panel or string can:
- reduce output disproportionately,
- affect the performance of the entire string,
- lead to significant generation loss during shaded hours.
Real-Life Impact (My Own Case)
In my case, a high-rise apartment was constructed on the western side, directly in the sun path of my rooftop solar system.

As a result:
- the solar panels experience shading in the late afternoon,
- shading lasts for approximately 1 hour every day,
- During this period, the system output drops by more than 20%.

This reduction is not due to system fault or poor panel quality — it is purely a shadow-related loss.
How This Affects Payback Period
Shadow-induced losses:
- reduce daily energy generation,
- lower annual electricity savings,
- and directly extend the payback period of the solar system.
Unlike degradation or maintenance, shadow growth is:
- unpredictable,
- often permanent,
- and usually not considered in installer payback calculations.
In severe cases, long-term shading can increase the payback period by 1–2 years, depending on the duration and timing of the shadow.
Key Takeaway
A rooftop may be shadow-free today, but solar systems must survive the environment of the next 25 years, not just the present.
Roof Repair and Waterproofing After Inspection
Roof repair and waterproofing are not direct solar system costs, but it is a real ownership costs that cannot be ignored once solar panels are installed on the roof. A rooftop solar system is mounted using a metal support structure that is firmly fixed to the roof. Over time, every roof weathers and ages. Cement plaster weakens, cracks develop, waterproofing layers fail, and water seepage becomes common — especially over a period as long as 25 to 30 years.

If the roof weakens, anything fixed on it will automatically start loosening, including the solar mounting structure. A loose or unstable structure can:
- affect panel alignment,
- increase vibration and stress,
- and in extreme cases, damage the entire solar system.
Because of this, roof health becomes an indirect but critical factor in long-term solar performance.
Why This Cost Is Inevitable
Even if a roof is in good condition at the time of installation, it is not realistic to expect it to remain maintenance-free for 25–30 years.
In most residential homes:
- roof repair,
- re-plastering,
- crack sealing,
- or waterproofing
will be required at least once during the lifetime of the solar power system.
This work may also involve:
- partial removal of panels,
- temporary dismantling of mounting structures,
- realignment and re-fixing after repairs.
How It Affects Solar Payback
While roof repair is not caused by solar, its cost and effort become unavoidable once solar is installed.
Expenses related to:
- roof waterproofing,
- structural strengthening,
- panel removal and reinstallation
do not directly increase solar generation, but they protect the system and prevent future damage. When ignored in payback calculations, the solar investment appears more profitable than it actually is.
Depending on roof condition and location, this can add 0.3–0.8 years to the actual payback period.
Key Takeaway
Solar panels may last 25 years, but roofs do not remain unchanged for that long.
A realistic solar evaluation must consider roof maintenance over the system’s life, even if it is not a direct component of the solar installation cost.
Mounting Structure Corrosion and Repainting Cost

The mounting structure of a rooftop solar system is usually made of galvanized iron (GI) or steel. While these materials are corrosion-resistant, they are not corrosion-proof. Time tests everything.
A rooftop solar system is expected to operate for 25–30 years. Over such a long period, the protective galvanizing or coating on the mounting structure gradually erodes due to:
- heat,
- rain,
- humidity,
- pollution,
- bird droppings (contain uric acids, ammonia compounds)
Once this protective layer weakens, corrosion starts silently. Corrosion may not be visible in the early stages, but it directly reduces the structural strength of the mounting system.

Why This Is a Serious Issue
The mounting structure holds the entire solar panel array. If the structure weakens:
- panel alignment is disturbed,
- mechanical stress increases,
- and in extreme cases, the entire array can be at risk of collapse or breakage.
This is not just a financial risk, but also a safety risk.
In systems where the structure is elevated — for example, 10 feet or higher, as in my own case — a weakened structure can pose a serious hazard if someone is standing or working underneath it.
What Maintenance Is Actually Required
To prevent long-term damage, periodic inspection and corrective action are essential, such as:
- checking early signs of rust or corrosion,
- removing the corroded layer,
- repainting exposed metal surfaces with anti-rust coating,
- inspecting structure footings,
- ensuring that the structure legs remain firmly cemented into the roof,
- re-cementing or strengthening the base if erosion or loosening is observed.
These activities are not covered under routine cleaning and often not included in basic AMC contracts.
Cost and Payback Impact
While structure repainting and reinforcement may not be frequent, it is a real lifecycle cost that occurs once or twice during the system’s life. Ignoring this cost can:
- increase long-term maintenance expenses,
- reduce system safety,
- and delay the actual payback period.
Depending on location and structure height, this can add 0.2–0.4 years to the solar payback period.
Key Takeaway
Panels may generate electricity quietly, but the structure supporting them must remain mechanically strong and safe for decades.
Mounting structure corrosion is a slow but serious risk — and repainting and reinforcement are necessary to protect both your investment and safety.
Opportunity Cost Of Capital
Rooftop solar is a profitable and stable long-term investment. It provides predictable savings, protects against rising electricity tariffs, and helps reduce carbon emissions. From a risk perspective, it is one of the safest investment options available to homeowners.
However, every investment comes with an opportunity cost.
When you invest money in a solar power system, that capital becomes locked in for a long period. This means the same amount of money cannot be invested elsewhere — for example, in fixed deposits, mutual funds, real estate, or any other project that may offer returns in the future.
The opportunity cost is the return you could have earned from the next best alternative, but didn’t, because the money was invested in solar instead.
Why This Matters in Payback Analysis
Opportunity cost does not add a direct expense to the solar system. You don’t pay it out of pocket. But financially, it behaves like a hidden cost, because it affects how attractive the investment really is when compared to other options. For example:
- If the same capital could have earned 8–10% annually elsewhere,
- and solar delivers savings equivalent to 7 – 8%,
The difference in returns is the opportunity cost you implicitly accept.
This difference does not appear in installer payback calculations, which focus only on electricity bill savings, not on capital efficiency.
Why Solar Still Makes Sense (Important Balance)
Unlike market-linked investments, solar offers:
- stable and predictable savings,
- low volatility,
- protection against electricity tariff inflation,
- non-financial benefits like energy independence and environmental impact.
Because of this, solar is often chosen not for maximum return, but for certainty and long-term stability.
How Opportunity Cost Affects “True ROI”
When opportunity cost is considered:
- the effective payback period appears longer,
- the investment looks less attractive compared to higher-risk alternatives,
- but more attractive compared to low-risk, fixed-return options.
This does not make solar a bad investment — it simply places it in the correct financial context.
Key Takeaway
Solar saves money with high certainty, but every rupee invested also carries a trade-off.
A complete solar evaluation should acknowledge opportunity cost, even though it does not appear as a direct system expense.
Monitoring Data Loss and Downtime
Most modern rooftop solar systems come with online monitoring — through a mobile app or web portal — which shows daily energy generation and system status.
Homeowners assume that if the system has monitoring, everything is working fine. In reality, monitoring itself can fail, and when that happens, system faults may go unnoticed for long periods.
How Monitoring Data Loss Happens
Monitoring data loss can occur due to:
- internet or Wi-Fi issues at home,
- router power failures,
- inverter communication module faults,
- server or app-side issues.
When monitoring stops updating, the system may still be running, or it may be partially or completely down, but the homeowner has no visibility.
Why This Leads to Hidden Downtime
If a fault occurs, such as:
- inverter tripping,
- string failure,
- DC connector issue,
- internal error,
and monitoring is not working, the system can remain offline for weeks or even months without the homeowner realizing it.
During this period:
- solar panels are installed,
- sunlight is available,
- but no electricity is being generated.
This is called undetected downtime.
How This Affects Solar Savings
Undetected downtime:
- permanently reduces annual solar generation,
- lowers electricity bill savings,
- and increases the actual payback period.
Because no repair cost is immediately visible, this loss is often completely ignored in payback calculations.
Payback Impact
Even a few weeks of unnoticed downtime every year can:
- reduce annual generation by 2–5%,
- and increase payback by 0.2–0.4 years over the system life.
This impact is higher in systems where:
- monitoring is rarely checked,
- inverter alarms are disabled,
- service response is slow.
Key Takeaway
Solar systems do not fail loudly — they fail quietly. Without reliable monitoring and periodic manual checks, generation losses can remain invisible, silently reducing long-term savings.
Grid Outage–Related Downtime (Loss of Generation)
In a grid-tied solar power system, electricity generation is directly linked to the availability of the grid.
Whenever the grid fails or shuts down, the solar inverter automatically stops generating power. This is not a defect — it is a mandatory safety feature known as anti-islanding protection.
The reason is simple and important.
If solar panels continue exporting electricity during a grid failure, there is a risk that:
- electricity could flow back into the grid,
- and if a utility electrician is working on the line at that time, it could cause a serious electric shock or fatal accident.
To prevent this, the inverter continuously monitors grid conditions and shuts down immediately when it detects a grid outage.
How This Affects Solar Savings
Although this safety feature is essential, it has a direct impact on solar savings.
Whenever the grid is unavailable:
- the solar system stops producing electricity,
- no energy is generated or exported,
- potential solar units are lost permanently.
The longer and more frequent the grid outages, the greater the loss of solar generation.
This loss is usually not considered in installer payback calculations, which often assume uninterrupted grid availability during daylight hours.
Real-World Impact
In areas with:
- frequent power cuts,
- load shedding,
- voltage instability,
the cumulative downtime over a year can result in a noticeable reduction in annual solar generation, especially during peak sunlight hours.
Even though each outage may seem short, the total lost generation over years adds up, reducing overall savings and slightly extending the payback period.
Payback Impact
Grid-related downtime:
- does not add a direct cost,
- but reduces annual savings,
which effectively behaves like a hidden cost.
Depending on outage frequency, this factor alone can increase the payback period by 0.2–0.5 years over the system lifetime.
Key Takeaway
A grid-tied solar system is only as productive as the grid allows it to be.
While anti-islanding protection is essential for safety, grid outages silently reduce solar generation, and this effect should be considered when estimating real-world solar payback.
Grid Tariff Structure and Fixed Charges
The savings from a rooftop solar system depend not only on how much electricity it generates, but also on how your local grid tariff is structured.
If the grid electricity rate in your area is lower than average, your solar savings will be lower, and the payback period will be longer. On the other hand, in locations where grid tariffs are high, the same solar system can recover its cost much faster.
This means that two identical solar systems, installed on similar rooftops, can have very different payback periods, simply because of differences in local electricity tariffs.
Role Of Grid Tariff Escalation
Another important factor is tariff escalation.
Electricity prices rarely remain constant over long periods. If grid tariffs increase at a higher rate:
- future solar savings increase,
- cumulative savings grow faster,
- and the payback period reduces.
In my location, the average grid electricity rate is around ₹8 per unit, and based on the last 15 years of tariff data, the average escalation works out to approximately 5% per year.
Ignoring tariff escalation often leads to:
- underestimating long-term solar savings,
- or misjudging the actual payback period.
Impact Of Fixed Charges
Apart from per-unit energy charges, DISCOMs also levy fixed charges on residential consumers. These charges are:
- payable even if electricity consumption is low,
- sometimes applicable even when net import is zero.
Fixed charges do not reduce when solar generation increases. This means:
- a portion of your electricity bill remains unchanged,
- and total bill savings from solar are lower than expected.
If fixed charges are high, they negatively impact solar payback, especially for smaller systems or low-consumption households.
Why Installers Often Ignore This
Most installer payback calculations assume:
- a single average tariff,
- minimal fixed charges,
- and simplified escalation assumptions.
In reality, tariff structure varies by state, DISCOM, and consumer category, making this a hidden but powerful factor affecting solar ROI.
Key Takeaway
Solar savings are directly linked to how expensive grid electricity is — and how fast it becomes more expensive over time.
Before going solar, it is essential to:
- analyse your actual tariff slab,
- understand fixed charges, and
- use realistic tariff escalation assumptions.
This analysis determines your true saving potential and, ultimately, the real payback period of your solar power system.
How Smart Homeowners Reduce These Hidden Costs
Hidden costs in a rooftop solar system cannot be avoided completely. However, they can be managed far more effectively once you are aware of them.
Earlier, these costs were “hidden” — they appeared suddenly, without warning, and homeowners were unprepared. Now, after understanding them, they are no longer hidden.
Knowing these costs in advance gives you time to plan, and planning always leads to savings.
Smart homeowners do not eliminate costs — they reduce their impact.
Why Smart Homeowners Do Differently
- They maintain panels regularly, knowing that dust accumulation reduces output and delays payback, they ensure timely and consistent cleaning, especially in high-dust areas.
- They choose better corrosion-resistant structures. Understanding that corrosion is a silent strength killer, especially in coastal or humid regions, they opt for high-quality galvanization or improved coatings and inspect structures periodically.
- They plan for future shading risks instead of assuming today’s conditions will remain unchanged, they check in advance for:
- nearby vacant plots,
- proposed buildings,
- fast-growing trees that may cause shadowing in the future.
- They select the inverter carefully Knowing that inverter replacement is inevitable, they:
- choose inverters with longer warranties,
- prefer reliable brands,
- and research replacement options well before the warranty expires, avoiding panic purchases.
- They monitor system performance regularly Awareness of monitoring data loss makes them:
- check generation data periodically,
- act quickly when data stops updating,
- prevent long periods of undetected downtime.
- They plan roof repair in advance Instead of reacting after damage occurs, they:
- assess roof health early,
- plan waterproofing or strengthening before problems escalate,
- avoid emergency dismantling or damage to the solar structure.
Why Preparation Saves Money
When you know what is coming:
- you avoid rushed decisions,
- you prevent small issues from becoming big failures,
- you reduce long-term expenses.
In practical terms, planning and awareness can reduce these hidden costs by 20–25% over the system’s lifetime, while also preventing:
- structural damage,
- safety risks,
- unnecessary system downtime.
Key Takeaway
Hidden costs hurt the most when they appear unexpectedly.
Once they are known, they become manageable.
A well-informed homeowner always gets better ROI, not because the system is cheaper, but because it is better managed.
Conclusion
The so-called “hidden costs” of rooftop solar are no longer hidden once you understand how a solar system actually behaves over its full life.
These costs cannot be avoided completely. Solar is a long-term asset, and like any long-term investment, it requires ownership, attention, and periodic spending. What makes the real difference is how well these costs are anticipated and managed.
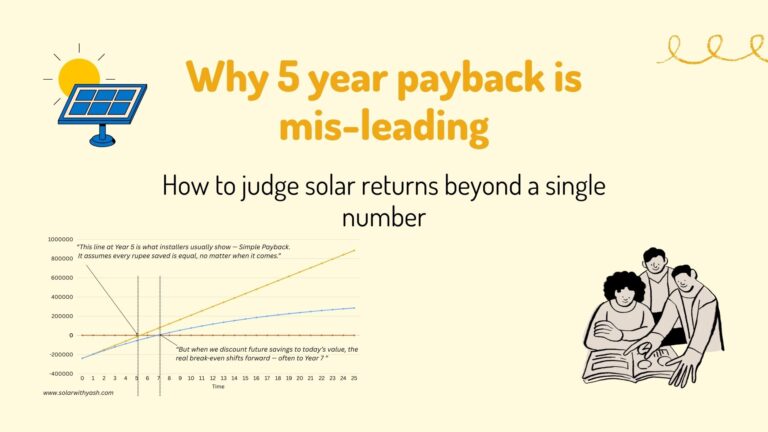
When hidden costs are ignored or poorly managed, they slowly reduce savings and stretch the payback period far beyond what was originally expected. In many cases, an installer-quoted payback of 5 years can easily extend to 7 years if these factors are not handled properly.
However, when these costs are known in advance and managed proactively, their impact reduces significantly. With better planning, timely maintenance, careful monitoring, and informed decisions, the same system can realistically achieve a payback of around 6 years, instead of drifting toward 7 years.
In simple terms:
- Optimistic installer payback: ~5 years
- Hidden costs ignored or unmanaged: ~7 years
- Hidden costs understood and managed well: ~6 years
The difference is not the solar system — the difference is the homeowner’s awareness and preparation.
Solar remains one of the most reliable and stable long-term investments for homeowners. Understanding these hidden costs does not make solar less attractive — it makes the decision more realistic, informed, and financially sound.
Final Thought
Solar rewards informed ownership. When you manage it like an investment, it performs like one.
“I personally use a detailed Solar Feasibility Spreadsheet that accounts for these costs”
Frequently Asked Questions: Hidden Solar Costs
1. Are these hidden costs applicable to every solar system?
Yes. Almost every grid-tied solar system experiences these costs over its lifetime, though the magnitude varies by location, usage, and maintenance quality.
2. Do hidden costs make solar unprofitable?
No. Solar remains a profitable and stable long-term investment, but ignoring hidden costs can delay the payback period.
3. Why don’t installers include these costs in payback calculations?
Most installers use first-year generation and simplified assumptions to quote optimistic payback figures and often ignore long-term lifecycle factors.
4. How much can hidden costs increase the payback period?
If unmanaged, hidden costs can extend payback by 1–2 years. With proper planning, this impact can be reduced significantly.
5. Can homeowners reduce these hidden costs?
Yes. Regular cleaning, proper monitoring, better equipment selection, and advance planning can reduce lifecycle costs by 20–25%.
6. Is inverter replacement really unavoidable?
Yes. Most inverters last 10–15 years, so at least one replacement during a 25-year system life is very likely.
7. Does solar panel degradation affect savings?
Yes. Panel output gradually decreases over time, which reduces future savings and slightly increases payback duration.
8. How do grid tariffs affect solar payback?
Higher grid tariffs and faster tariff escalation improve solar savings, while low tariffs and high fixed charges delay payback.
9. Does shading that appears later really matter?
Yes. Even partial shading for 1–2 hours daily can reduce annual generation significantly and extend payback.
10. What is the realistic payback homeowners should expect?
For most homes:
- Optimistic installer quote: ~5 years
- Hidden costs unmanaged: ~7 years
- Hidden costs managed well: ~6 years