Why First-Year Savings Don’t Predict Lifetime ROI
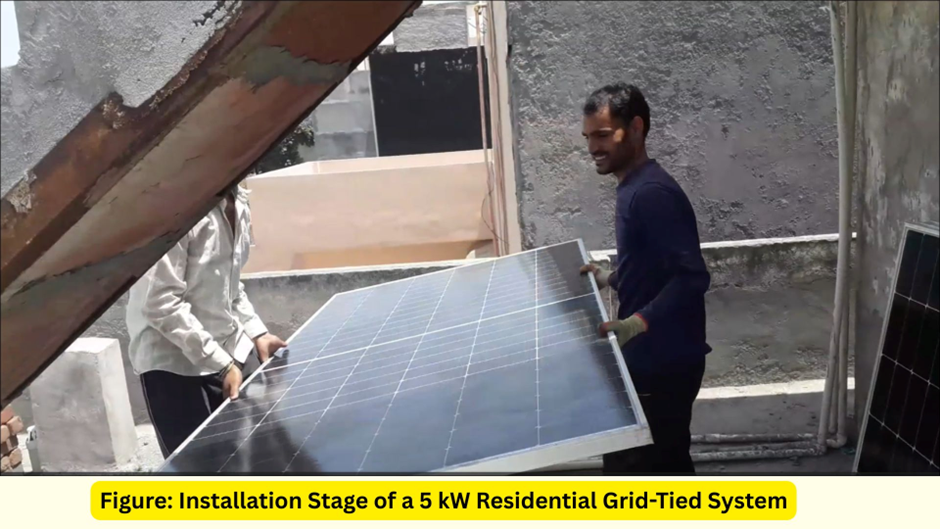
When I installed my 5kW rooftop solar system in August 2022, the expectation sounded straightforward: the system should save over ₹5,000 per month on electricity bills. Like many homeowners, I immediately visualised those savings repeating year after year. Multiply that number across two decades, and the investment appeared almost self-explanatory. But as I began tracking real performance data and analysing long-term feasibility more closely, I realised something important — first-year savings can create a misleading picture of lifetime ROI.
The first year of solar ownership often feels impressive. Generation is at its highest, policies are favorable, and electricity bill reductions are visible from the very first cycle. It’s natural to treat this early performance as a financial baseline. However, solar is not a one-year story; it is a 20–25-year journey shaped by gradual technical and economic shifts. Panel degradation, inverter replacement timelines, seasonal production changes, evolving net-metering rules, and realistic tariff growth all influence the long-term outcome far more than the initial months ever suggest.
This article comes from both personal experience and years of analysing residential solar feasibility. My intention is not to reduce enthusiasm for solar — in fact, I remain strongly optimistic about its long-term value for homeowners. Instead, the goal is to move beyond the “first-year mindset” and understand how lifetime ROI should truly be evaluated, so expectations remain realistic, confident, and financially sound from day one to year twenty-five.
Why First-Year Savings Look So Impressive
In the first year after installing a rooftop solar system, almost everything is working in your favour — technically, financially, and even psychologically. The entire setup is new: solar panels, inverter, wiring, mounting structure, and protection systems.
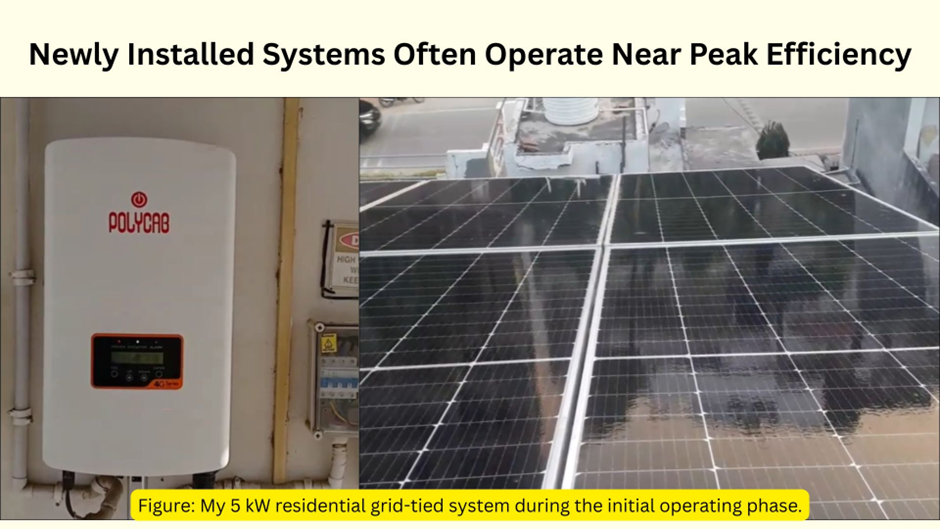
Because of this, the system operates close to its maximum efficiency. Losses are minimal, performance is strong, and the gradual effects of panel degradation are not yet visible. Naturally, generation numbers look impressive, and the electricity bill drops sharply.
At the same time, policy benefits often amplify this early impact. Subsidies or incentives create a feeling that a portion of your investment has instantly returned to you. Net-metering credits begin appearing on bills, and for many homeowners, the monthly electricity expense suddenly falls by 80–90%. This immediate financial relief creates a powerful emotional response — it feels like the system is “earning” from day one.
Another reason the first year looks exceptionally attractive is the way projections are presented. Installers usually assume steady tariff escalation, ideal generation conditions, and minimal downtime. These assumptions are not necessarily wrong, but they are often optimistic. When you combine peak system performance, policy benefits, and positive projections, the early financial picture appears brighter than what long-term reality may eventually show.
From a homeowner’s perspective, it is easy to believe that the first year represents the true baseline for the next two decades. But in reality, the first year is more like a snapshot taken at the most favorable moment. Everything is new, everything is performing well, and expectations are high.
Key Insight: Year-1 savings are a photo, but lifetime ROI is a movie. The real financial story of solar unfolds slowly over time, shaped by factors that become visible only after the initial excitement settles.
The 5 Factors That Change ROI After Year One
The financial story of a solar system begins to evolve quietly after the first year. While early savings often look strong, long-term ROI is shaped by technical realities, policy changes, and real-life usage patterns. These factors don’t reduce the value of solar — but they do change how the numbers unfold over time.
Panel Degradation Over Time
Solar panels slowly lose efficiency every year, typically around 0.5–0.8% annually. This drop is gradual and almost invisible month to month, but over a decade it becomes meaningful. When lifetime ROI is calculated without degradation curves, projections can look slightly more optimistic than real performance.
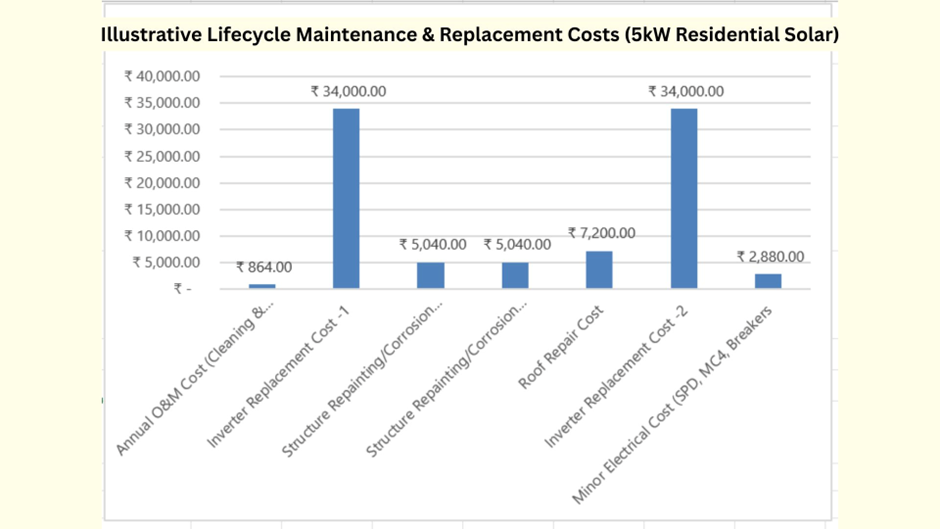
Maintenance & Inverter Replacement
In the first year, systems require very little attention. But over the long term, inverter replacement, occasional servicing, and cleaning costs must be included in financial planning. Ignoring these future expenses may make early ROI calculations appear stronger than what homeowners eventually experience.
Changing Net Metering Rules
Policy stability plays a major role in residential solar economics, especially in India. Net-metering regulations, export tariffs, or billing structures may evolve. Even small policy adjustments can shift long-term savings, which is why ROI should always be evaluated with realistic assumptions rather than fixed expectations.
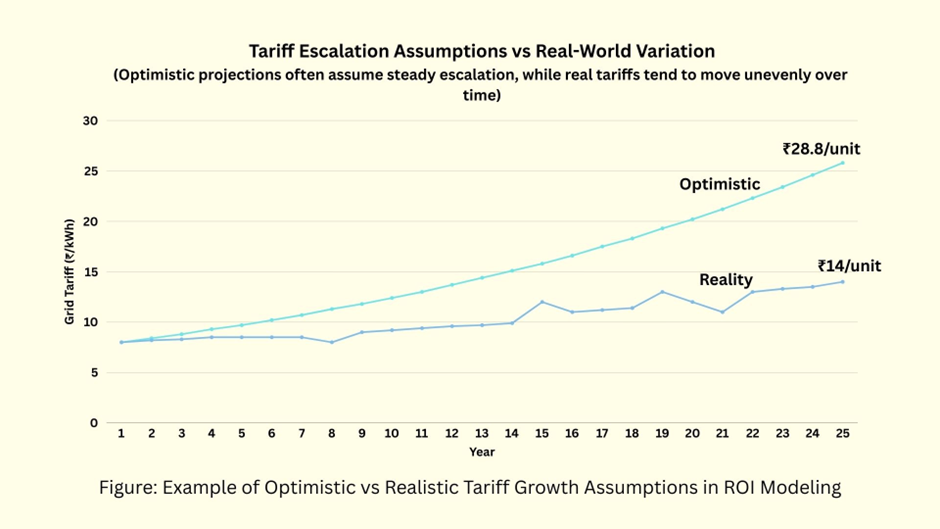
Tariff Escalation vs Reality
Many projections assume electricity tariffs will rise steadily every year. While escalation does happen, real-world increases are rarely perfectly linear. Overestimating tariff growth can inflate lifetime ROI projections, making the first-year savings feel like a guaranteed trend — which may not always be the case.
System Downtime & Real-World Behavior
Beyond technical factors, everyday realities influence performance. Dust accumulation, seasonal sunlight variations, partial shading, and even household consumption patterns shape annual savings. In my own 5 kW system, for example, I observed that yield and revenue dropped by about 2.6% between 2024 and 2025.
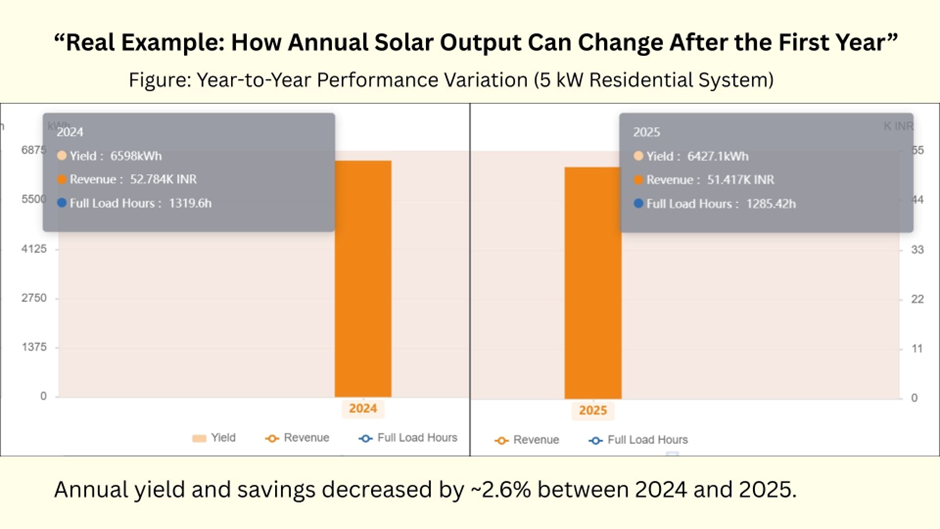
A single issue didn’t cause this — it was the combined effect of dust settling on the panels, natural degradation, seasonal changes in the solar resource, and partial shading from a nearby building after 4 pm on the western side.

None of these factors felt dramatic individually, but together they slightly reduced annual performance. Experiences like this highlight why long-term ROI cannot rely only on first-year numbers.
This is also where structured feasibility modeling becomes valuable. Instead of assuming constant performance, tools like a detailed Solar Feasibility Spreadsheet help simulate degradation, shading effects, tariff assumptions, and lifecycle costs together — giving homeowners a clearer picture of how ROI evolves beyond the initial years.
Why Installers Still Use First-Year Savings
In many residential solar proposals, the financial discussion begins — and sometimes ends — with first-year savings. This approach is not always about oversimplifying the system; in many cases, it is simply the easiest way to communicate value. A single monthly saving number is quick to understand, and basic payback calculations based on year-one performance feel straightforward for homeowners who may be new to solar economics.
From a sales perspective, first-year projections also help create faster decision cycles. When the payback period appears short and the savings look immediate, the system feels less risky. Explaining long-term feasibility, however, requires discussing degradation, tariff uncertainty, policy changes, and lifecycle costs. Concepts that can be harder to communicate during an initial consultation. As a result, simplified projections often become the default conversation.
Homeowner behaviour plays a role as well. Many customers naturally prefer to focus on the greener, more optimistic picture of solar adoption. A strong first-year saving creates excitement and confidence, and not everyone wants to explore detailed long-term modeling before making a decision. When both installers and customers gravitate toward simplicity, the first year begins to represent the “complete” story. Even though it is actually the most optimistic phase of the system’s lifecycle.
This doesn’t mean installers are wrong to highlight early savings. It simply means that first-year performance should be viewed as an introduction, not a conclusion. A more realistic understanding emerges when those initial numbers are placed within a long-term financial framework — one that reflects how solar systems truly perform over decades rather than just during their strongest starting year.
How Real Lifetime ROI Should Actually Be Calculated
If first-year savings show only the starting point, then real lifetime ROI requires a broader financial lens. A residential solar system is not just an energy upgrade — it is a long-term cash flow model that evolves over 20–25 years. Instead of relying only on simple payback numbers, a realistic evaluation looks at how costs, savings, and performance change gradually over time.
One of the most important shifts is moving from simple payback toward cash flow modeling. Payback tells you when the system might recover its initial cost, but it does not fully capture how savings accumulate after that point or how future expenses influence the outcome. When we consider discounted value — where future savings are adjusted for inflation and the time value of money — the picture becomes more grounded and financially meaningful.
Electricity prices also need to be viewed through an inflation-adjusted lens. While tariffs may rise, the increase is rarely perfectly linear. Modeling realistic escalation instead of optimistic projections helps prevent overestimating long-term returns. Similarly, lifecycle expenses such as inverter replacement, periodic maintenance, and policy-related changes should be part of the calculation.
These factors may seem small individually, but together they shape the true financial journey of the system.
A simplified way to think about lifetime ROI is through a structured framework:
Real ROI Modeling Typically Includes:
- Total energy generation across 25 years, not just the first year
- A gradual degradation curve reflecting real panel behavior
- Maintenance and operational costs over time
- Inverter lifecycle and replacement planning
- Policy assumptions such as net-metering and tariff structures
When homeowners begin viewing solar through this long-term framework, the numbers become less about immediate excitement and more about sustainable financial clarity. The goal is not to make solar appear less attractive — but to make the expectations more realistic, confident, and aligned with how the system actually performs over decades.
If you’re interested in understanding why many payback estimates miss important lifecycle factors, I’ve explored this topic in more detail in my eBook, “Why Solar Payback Calculations Are Wrong.” It expands on the financial assumptions behind ROI and explains how homeowners can evaluate solar investments with greater clarity.
A Simple Example: Same System, Two ROI Stories
To understand why lifetime modeling matters, let’s imagine the same 5 kW residential solar system evaluated in two different ways. The technical setup is identical — same panels, same inverter, same location — but the financial interpretation changes depending on how ROI is calculated.
Scenario A: First-Year Extrapolation
In this approach, the homeowner looks at strong first-year performance and assumes similar savings will continue every year. The payback calculation is simple: divide the system cost by annual savings, and the result appears attractive. Because the first year reflects peak efficiency, optimistic tariff assumptions, and no major expenses yet, the payback period looks shorter and the lifetime returns appear highly favorable. On paper, the system may seem to recover its cost very quickly.
Scenario B: Full Feasibility Model
Now, consider the same system evaluated using long-term feasibility modeling. Instead of assuming constant performance, the calculation includes gradual panel degradation, realistic tariff escalation, inverter replacement planning, and maintenance costs. Cash flows are spread across 20–25 years rather than based on a single year’s snapshot.
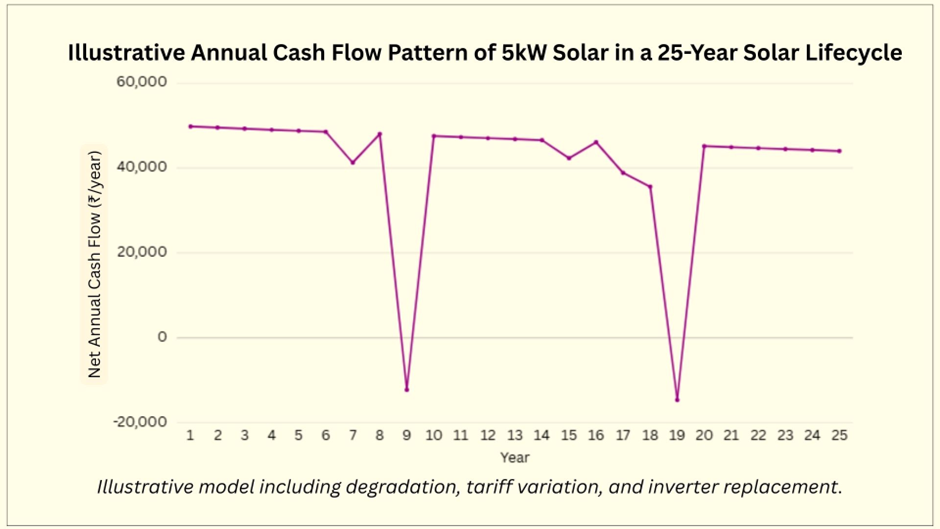
When these real-world factors are included, the financial story changes slightly — payback may extend by two to three years, and the projected lifetime ROI becomes more balanced and realistic.
The important insight here is not that one method is “right” and the other is “wrong.” First-year extrapolation offers a quick overview, while full feasibility modeling provides a deeper understanding of long-term performance. However, when homeowners rely only on the initial numbers, they may build expectations around the most optimistic phase of the system. This is why long-term analysis often reveals a different perspective. One that aligns more closely with real operational behavior over decades. If you want to explore this idea further, you may also find this related discussion helpful: Why Your Solar Payback Calculation Is Wrong by 2–3 Years
What Smart Homeowners Should Ask Before Going Solar
Before finalising a solar decision, it helps to move beyond attractive first-year numbers and ask a few deeper questions about long-term performance. A well-designed system is not just about installation quality — it is also about how realistically the financial expectations are set from the beginning. Asking the right questions early can prevent confusion later and help you evaluate proposals more confidently.
One of the first things to clarify is whether panel degradation has been included in the projections. Since solar modules slowly lose efficiency each year, long-term generation estimates should reflect this gradual change instead of assuming constant performance. Similarly, homeowners should ask if inverter replacement or lifecycle costs have been modeled. While these expenses may occur years later, they still influence lifetime ROI.
Another important aspect is how savings are calculated over time. Is the ROI adjusted for inflation and realistic tariff growth, or is it based on a fixed assumption that electricity prices will always rise at the same rate? Understanding whether the numbers reflect inflation-adjusted cash flow helps separate realistic projections from overly optimistic ones.
Policy stability also deserves attention. Net-metering structures and billing rules can evolve, so it is worth asking whether the proposal discusses policy-related risks or assumptions.
A transparent conversation around these factors usually indicates a more thoughtful feasibility approach. These questions are not meant to complicate the decision — they simply help homeowners see the full financial picture. When proposals are evaluated with this level of clarity, solar becomes less about quick payback estimates and more about making a confident, long-term energy investment.
Conclusion — Solar Is Still Powerful, But Realistic Modeling Matters
Residential solar remains one of the most meaningful long-term investments a homeowner can make. It offers financial benefits, energy independence, and long-term sustainability. Over the past few years, I have seen how rooftop systems can transform electricity bills. They create predictable savings and give homeowners a sense of control over rising energy costs. Looking beyond first-year savings does not reduce enthusiasm for solar. Instead, it makes that enthusiasm more informed and resilient over time.
When expectations are built only on strong initial performance, small changes in later years can feel disappointing. In reality, these variations are completely normal. Realistic modeling helps bridge the gap between expectation and actual performance. By considering degradation, lifecycle costs, tariff behavior, and policy assumptions early, homeowners can build a clearer financial roadmap. This roadmap reflects how solar performs across decades, not just during its first year.
Solar works best when optimism is supported by understanding. A well-evaluated system may not always promise the shortest payback on paper. However, it often delivers a more stable and confident long-term outcome. In the end, clarity turns a good investment into a sustainable one.
👉 Before investing thousands in solar, evaluate your real lifetime ROI — not just your first electricity bill.
Author’s Note: This article combines analysis from my 5kW residential solar system installed in August 2023 with long-term feasibility modeling used in my Solar Feasibility Spreadsheet.