Why Exported Solar Units Are Often Overvalued (And How It Changes Your Real Payback)
Once you install solar, the first thought that naturally comes to your mind is simple:
“My solar is going to generate around 20 units per day. Even if my family and I are out for a day, those units will be exported to the grid — and I will be compensated.”
And yes, you will be compensated. But here is where the silent assumption enters.
Most homeowners — and even many installers — assume that exported solar units are valued at the same rate at which electricity is imported from the grid.
On paper, this makes the return on investment (ROI) look very attractive.
In reality, this assumption quietly overvalues exported units and makes payback appear shorter on paper.
But once actual billing begins, the real payback can stretch by years — and most homeowners realize this only after installation.
The Common Assumption That Makes ROI Look Attractive
Consider a simple example.
A family installs a 5kW grid-tied solar system. On average, the system generates:
- 20 units per day
- Grid import rate = ₹8 per unit
Now the basic calculation most installers show is:
- 20 units × ₹8 = ₹160 per day
- ₹4,800 per month
- ₹57,600 per year
If the system cost after subsidy is ₹2,40,000, the simple payback becomes:
₹2,40,000 / ₹57,600 ≈ 4.2 years
At this stage, everything looks excellent.
Four years of payback. After that, “free electricity.”
But this calculation hides one crucial question:
How much of that 20 units is actually consumed inside the home?
Because solar economics is not about how much you generate — it is about how much electricity you avoid purchasing. Solar payback is not a fixed number. It changes depending on consumption timing, export percentage, tariff structure, and policy environment. I’ve explained this variability in detail here, “Why 5 Year Payback is Misleading.”
When We Dig Deeper: Consumption Pattern Changes Everything
Now, suppose we analyse the actual consumption pattern of the family.
We find that:
- 40% of solar is self-consumed during the day
- 60% is exported to the grid
So, from 20 units:
- 8 units are self-consumed
- 12 units are exported
Now comes the economic reality.
The export rate is not ₹8. It is ₹4 per unit.
This is common in many states under net billing structures. Now let us calculate again:
8 × ₹8 = ₹64
12 × ₹4 = ₹48
Total daily savings = ₹112, not ₹160.
That is ₹48 per day overestimation.
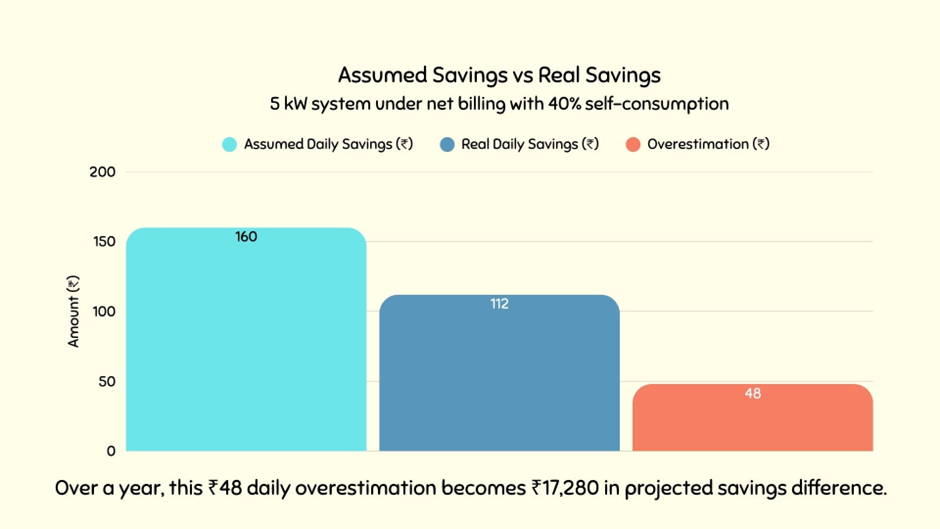
Now the revised numbers:
₹112 per day
₹3,360 per month
₹40,320 per year
New payback:
₹2,40,000 / ₹40,320 ≈ 6 years
Same system, same generation, and the same household.
But payback stretches from 4.2 years to nearly 6 years.
This is the real impact of overvaluing exported solar units.
Over a 25-year system life, this difference can translate into tens of thousands of rupees in miscalculated savings.
The Concept of Blended Solar Value (The Missing Calculation)
To properly model solar economics, we must calculate what I call the Effective or Blended Solar Rate.
The formula is simple:
Effective Solar Rate =
(% Self-consumed × Import Rate) +
(% Exported × Export Rate)
In our example:
(0.4 × 8) + (0.6 × 4)
= 3.2 + 2.4
= ₹5.6 per unit
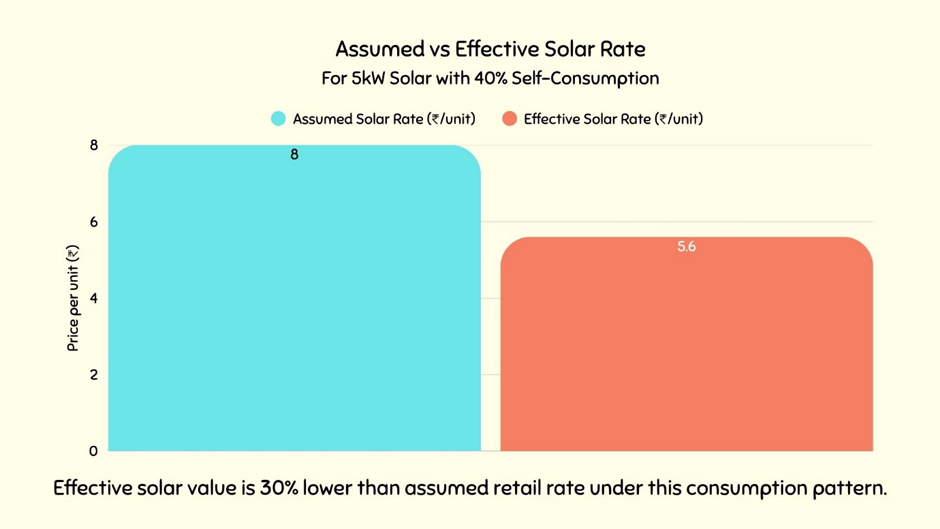
So instead of valuing solar at ₹8 per unit, the real effective value of each unit generated is ₹5.6.
That is 30% lower than assumed.
Now think about this carefully.
If your feasibility model assumes ₹8 per unit, but your real blended rate is ₹5.6, your ROI calculation is fundamentally distorted.
This is why many homeowners feel disappointed after installation — actual savings feel lower than promised.
Why Is the Same Unit Valued Differently?
Many homeowners feel confused at this stage.
“If I export 12 units during the day and import 12 units at night, why is one valued at ₹8 and the other at ₹4?”
The answer lies in timing.
Electricity is not just energy. It is time-sensitive energy.
You import electricity at night or in the evening when residential demand is high. The grid is supplying power during peak demand hours. That power has higher economic value.
You export electricity during midday, when:
- Solar plants are generating
- Many homes are exporting
- Commercial solar is active
- Grid supply is abundant
Higher supply and lower marginal demand reduce the economic value of that unit.
Same energy. Different time. Different market condition.
The grid also cannot store your excess solar energy and give it back at night at the same retail value. Large-scale storage is limited and expensive. Electricity must be balanced in real time.
So economically:
Daytime export = surplus power
Night import = premium demand power
No one is cheating you. This is basic demand-supply economics.
Retail Price vs Buyback Price
This is another important distinction.
When you self-consume solar power, you are avoiding the retail tariff. That is ₹8 in our example.
When you export solar, you are selling power at a regulated buyback rate. That is ₹4.
Retail price is what you pay as a consumer.
Buyback price is what the utility pays as a purchaser.
These two are not the same because:
- Retail price includes transmission, distribution, cross-subsidy, and infrastructure costs.
- Export price reflects only the energy component.
- Understanding this difference is crucial in realistic ROI modelling.
Net Metering vs Net Billing vs Gross Metering
Another layer that most homeowners are unaware of is the billing structure.
Under Net Metering, exported units directly offset imported units at the same rate (subject to policy limits). This structure gives better economics.
Under Net Billing, export and import are valued separately, which is the case in many states today. This creates the blended rate scenario we calculated.
Under Gross Metering, all solar-generated electricity is sold at the export rate, and all consumption is purchased at the retail rate. In such cases, payback is significantly longer unless export rates are attractive.
Before installing solar, homeowners must clearly understand which structure applies to them.
Without this clarity, payback estimates become unreliable.
Regulatory Risk: Export Rates Can Change
Export rates are not purely market-based.
They are determined by:
- State DISCOMs
- Electricity Regulatory Commissions
- Policy frameworks
Export rates may be:
- revised downward
- capped for larger systems
- changed under new solar policies
Suppose the export rate in our example drops from ₹4 to ₹3 per unit.
Then, daily savings become:
8 × ₹8 = ₹64
12 × ₹3 = ₹36
Total = ₹100 per day
Annual savings = ₹36,500
Now payback becomes:
₹2,40,000 / ₹36,500 ≈ 6.5 years
A small tariff change stretches payback by another 6–8 months.
This is why export-heavy systems carry higher regulatory risk.
In several states, annual surplus export is settled at APPC (Average Power Purchase Cost), which may be ₹2–₹3 per unit — significantly lower than retail tariffs.
Bigger Solar Is Not Always Better
Most people think:
“Let me install a slightly bigger system. More generation means more savings.”
Not necessarily.
If additional generation increases export percentage, the blended solar rate decreases.
Solar should ideally be sized to maximize self-consumption — not maximum generation.
There is a point where adding extra capacity gives diminishing economic returns.
The objective is optimization, not maximization.
This is where serious feasibility modelling becomes important.
Beyond a certain size, each additional kilowatt may generate more export than savings, reducing the marginal return on investment.
The Real Solution: Smart Sizing Based on Daytime Load
Solar sizing should not be based only on annual consumption.
It must consider:
- Daytime consumption ratio
- Future lifestyle changes
- Load shifting potential
For example if you:
- are planning to buy an EV and charge during the day, self-consumption will increase.
- work from home, daytime load increases.
- are retiring soon, daytime presence increases.
- family size increases, cooking and appliance usage patterns may change.
Two families with identical annual consumption can have completely different paybacks depending on when they consume electricity.
This is why consumption pattern analysis is non-negotiable in serious solar ROI modelling.
The Long-Term Perspective: Tariff Escalation
Grid tariffs typically increase over time.
When retail tariff rises:
- Self-consumed solar becomes more valuable.
- Export rates may not increase at the same pace.
Over the long term, systems with higher self-consumption benefit more from tariff escalation.
Export-heavy systems remain relatively constrained.
Again, consumption pattern drives long-term ROI.
What Homeowners Should Ask Before Installing Solar
Instead of asking only, “What is the payback?” ask:
- What percentage of my solar will be self-consumed?
- What export rate are you assuming?
- What is my blended solar value?
- Which billing structure applies to my state?
- What happens if export rate changes?
If your installer cannot answer these clearly, your ROI is being approximated — not modeled.
Serious solar decisions require structured modeling that accounts for blended solar value, export ratios, tariff escalation, and long-term cash flow. That is exactly why I built the Solar Feasibility Spreadsheet (SFS) – India Edition and US Edition a structured tool designed to calculate real residential solar ROI based on your actual consumption pattern and billing structure.
Conclusion: The Real Reason Exported Solar Units Are Overvalued
Solar economics is not about how much you generate — it is about how much electricity you avoid purchasing.
Exported solar units are often overvalued because most payback calculations assume they are equal to imported units at retail tariff.
In reality, their economic value depends on:
- When they are generated
- When they are consumed
- Your billing structure
- The applicable export tariff
- Your consumption behavior
If you are under net metering and your annual export does not exceed your annual import, exported units are effectively adjusted at retail rate within the billing cycle. In such cases, the overvaluation issue reduces significantly.
However, in states following net billing — or where annual surplus export is settled at APPC or regulated buyback rates — the difference becomes substantial. In such structures, exported units are not economically equal to imported ones, and assuming parity can materially shorten the projected payback on paper.
This is why understanding your state’s billing mechanism is critical before modelling solar ROI.
When exported units are incorrectly valued at retail rates in feasibility calculations, payback appears shorter.
But once the system is installed and actual billing begins, many homeowners notice that savings are lower than projected.
This gap between expectation and reality usually comes from ignoring blended solar value and consumption pattern dynamics.
Solar is a powerful investment. But like any investment, it must be evaluated using accurate assumptions — not optimistic simplifications. And that is where serious solar feasibility analysis makes the difference.
Before You Trust Any Solar Payback Number…
If you have ever been told:
- “Solar will pay back in 4–5 years.”
- “Exported units are equal to imported units.”
- “Your savings will be ₹60,000 per year.”
Pause.
Because solar payback is not a fixed number.
It depends on:
- Consumption timing
- Billing structure
- Export tariff
- Blended solar value
- Regulatory risk
- Real cash flow modeling
Most payback calculations are simplified.
Some are unintentionally optimistic.
A few are structurally wrong.
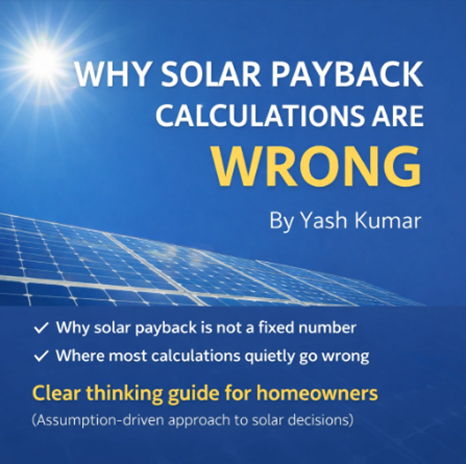
That is exactly why I wrote:
📘 “Why Solar Payback Calculations Are Wrong.”
In this analytical eBook, I break down:
- Why two installers give two different payback periods
- Why first-year savings don’t predict lifetime ROI
- How export-heavy systems distort returns
- Simple Payback vs Real Payback
- How to calculate your real blended solar value
- The hidden assumptions most proposals never show
If you are investing lakhs into solar, you deserve financial clarity — not marketing math. Read the eBook before signing your solar contract.