Why Your Solar Payback Calculation Is Wrong by 2–3 Years (And What Most Estimates Miss)
Introduction
Most homeowners don’t realize this, but the solar payback period shown to them is often optimistic by two to three years, even when the calculation looks professional and well-intentioned.
This doesn’t always happen because someone is trying to mislead you.
It happens because payback calculations are usually simplified, and simplification hides important assumptions.
Rooftop solar is a long-term system. But payback is often calculated as if the system behaves the same way every year — producing the same number of units annually, has no mid-life costs, and converts every generated unit into usable savings.
In reality, solar performance changes over time, costs don’t remain static, and savings depend heavily on how and when electricity is actually used.
When these factors are ignored — even unintentionally — the result is a payback estimate that looks reassuring on paper, but takes significantly longer to achieve in practice.
In this article, we’ll break down where the extra 2–3 years come from, and why a correct solar payback calculation needs to go beyond the basic formula most people rely on.
What homeowners think the “payback period” means
For most homeowners, the payback period is understood in a very simple way.
It is usually calculated as:
Net system cost (after subsidy, if applicable) divided by annual electricity bill savings.
Assuming the net cost of 5kW solar after subsidy is ₹2,40,000 and the annual expected savings are ₹58,000. Then the payback period in this case would be: ₹2,40,000/₹58,000 = 4.14 years (A simple and easy calculation).
This definition feels intuitive.
It is easy to explain, easy to understand, and easy to market.
That is why it is used so widely in solar quotations and online calculators.
However, while this approach is simple, it is not complete.
This method assumes that the solar system behaves the same way every year — producing roughly the same number of units annually, with no aging effects and no significant costs after installation.
In reality, solar systems do not behave like that.
A correct payback calculation must account for several factors that are commonly ignored, such as:
- The time value of money, where savings received years later are worth less than savings today
- Solar panel degradation, which reduces annual generation over time and varies from one technology to another
- Lifecycle costs, such as inverter replacement and maintenance escalation, which occur after the system has already started operating
When these factors are ignored, the calculated payback period almost always appears shorter and more optimistic than what happens in practice.
As a result, many homeowners discover that their real payback is delayed by 2–3 years, not because solar is a flawed technology, but because the original calculation did not account for the system’s aging, lifecycle costs, and long-term financial realities.
Where does the 2-3 years error actually come from?
The 2 to 3-year error in solar payback does not come from a single mistake.
It emerges from a series of small assumptions that appear reasonable individually, but compound over time.
Assumption #1: Wrong sunlight data (PSH)
Most solar payback calculations begin with an assumption about the amount of sunlight the system will receive. This is usually done using average Peak Sun Hours (PSH).
The problem is that most calculations rely on state-level average PSH values.
In reality, solar availability does not remain uniform across an entire state — especially in geographically large and climatically diverse states.
Solar radiation can vary significantly:
- from district to district, or
- from coastal to inland regions, even when both locations lie within the same state.
For example, consider Maharashtra.
Both Pune (an inland region) and Ratnagiri (a coastal region) are located in the same state. Yet, their solar availability is different:
- Ratnagiri (coastal): PSH ≈ 5.06
- Pune (inland): PSH ≈ 5.35
If a single state-average PSH value is used for both locations, a generation error is unavoidable.
| Location | Region type | Typical PSH (kWh/m²/day) |
|---|---|---|
| Ratnagiri | Coastal | ~5.06 |
| Pune | Inland | ~5.35 |
| Maharashtra (state average) | Aggregated | ~5.20–5.25 |
This difference may look small on paper, but even a 5–7% error in annual generation can shift the payback period by 6 to 12 months.
More importantly, this error does not occur just once.
Because solar generation is estimated every year using the same incorrect PSH value, the error keeps compounding over the entire life of the project, typically 20–25 years.
As a result, what begins as a minor sunlight assumption error gradually translates into a significant delay in real payback, contributing substantially to the 2–3 year gap many homeowners experience.
I have written a separate, detailed guide on how district-level solar irradiance affects rooftop solar performance in Maharashtra, which explains this variation in more depth.
Assumption #2: Inverter replacement is ignored
Most solar payback calculations assume that once the system is installed, there are no major costs for the next 25 years.
This assumption is incorrect.
While solar panels are designed to last 25 years or more, inverters do not.
The inverter is the heart of the solar power system. It converts the DC electricity produced by solar panels into AC electricity that runs household appliances. Without a functioning inverter, the solar system cannot operate.
Although modern inverters are efficient and durable, they are still electronic power devices with a limited lifespan.
In real-world operating conditions, inverter replacement is typically required once every 8–12 years.
Over a 25-year project life, this usually means:
One to two inverter replacements
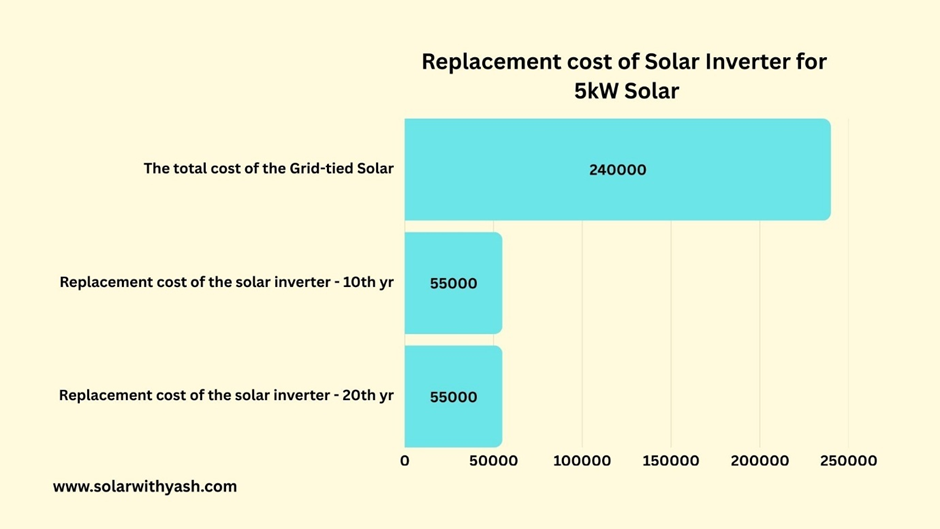
This is not a minor expense.
Depending on the system configuration and subsidy structure:
- The inverter typically accounts for 20–23% of the total system cost after subsidy
- And around 18–20% of the total system cost without subsidy
When this cost is ignored in payback calculations, the payback period appears artificially shorter than it should be.
In reality, a mid-life inverter replacement introduces a high, one-time cost during the operating life of the system. This expense effectively pushes the payback clock forward and, in some cases, can reset the payback clock altogether.
However, most online solar calculators and many installer quotations do not include inverter replacement costs when estimating payback.
As a result, homeowners are often surprised later — not because solar failed, but because a major lifecycle cost was never included in the original calculation.
Key insight: A single mid-life inverter replacement can significantly delay real payback, even if the system performs well otherwise.
Assumption #3: 100% self-consumption is assumed
Many solar payback calculations quietly assume that every unit of electricity generated by the solar system is fully utilized by the household.
In other words, they assume 100% self-consumption.
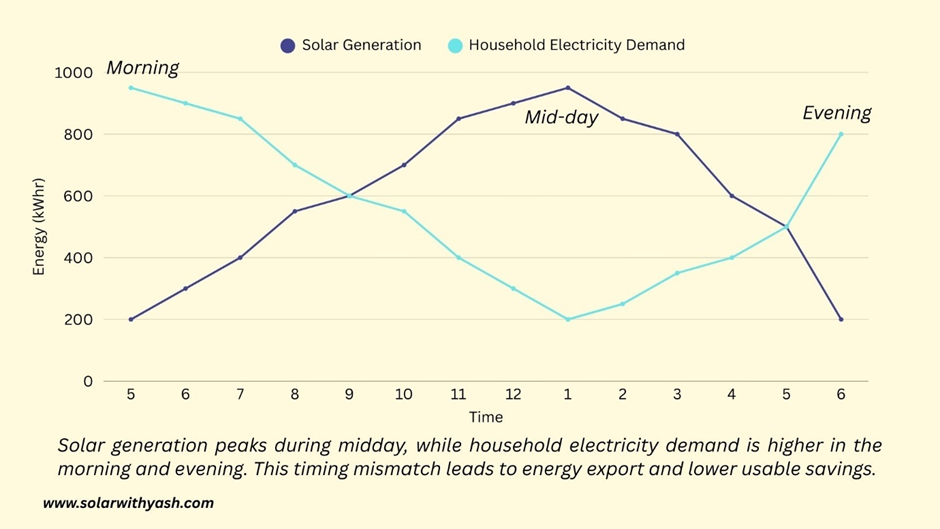
In practice, this rarely happens. Solar panels generate the maximum electricity during the middle of the day, when many households have relatively low electricity usage.
As a result, a portion of the generated energy is exported to the grid.
This is where the problem begins.
Most electricity distribution systems impose export limits through net-metering or net-billing rules. Even when export is allowed, exported units are often valued lower than imported grid electricity.
So, while a solar system may generate a certain number of units on paper, not all of those units translate into equal financial savings.
Another mismatch occurs because household consumption patterns rarely align perfectly with solar generation patterns. Morning and evening loads are typically higher, while solar generation peaks around noon.
When this timing mismatch is ignored, savings appear larger on paper than they are in reality.
As a result:
- Generation numbers may look strong
- Annual savings may look attractive
- But actual usable savings are often lower than assumed
- Annual savings may look attractive
- But actual usable savings are often lower than assumed
This gap between generated energy and usable savings directly delays payback.
Key insight: Paper savings are not the same as usable savings.
Ignoring self-consumption realities and export valuation can quietly add months or even years to the real payback period — even when the solar system is technically well-designed.
*If exported electricity is credited at the same rate as imported electricity, and export limits do not apply, the financial impact of self-consumption mismatch is minimal. However, when export limits exist or export tariffs differ, assuming 100% self-consumption can significantly overstate savings and delay real payback.
Assumption #4: Panel degradation is treated casually
Like any other energy system, solar panels do not produce the same output forever.
Their performance gradually declines over time, a process known as panel degradation. However, most payback calculations quietly assume that the solar system will produce the same number of units every year.
In many cases, the first-year generation is simply converted into annual savings and then repeated year after year to estimate payback.

This assumption is unrealistic.
In reality, solar panels lose output every year, which means that annual savings also reduce gradually over time. The reduction is not sudden or dramatic — but it is continuous.
This is why flat annual savings over 20–25 years is an illusion.
Another important point is that not all solar panels degrade at the same rate.
Even for the same system size, different panel technologies experience different degradation behavior, which directly affects long-term generation and payback. Typically:
- Solar panels experience higher degradation in the first year, often around 2–3% of rated power (Pmax)
The higher performance drop seen in the first year is often due to the Light-Induced Degradation (LID) effect, which I have explained in detail in my article Why Do Solar Panels Lose Power After Installation? Understanding the LID Effect.
- After the first year, degradation usually slows down to around 0.3% to 0.6% per year from year 2 onward
- The exact rate depends on the panel technology and quality
When degradation is ignored, early-year savings are overstated, and later-year savings are assumed to be higher than what actually occurs.
Over the life of the project, this gradual loss of output quietly pushes the real payback further out, contributing significantly to the 2–3 year delay many homeowners experience.
Key insight: Panel degradation doesn’t look scary — but it steadily reduces savings and quietly delays real payback.
Assumption #5: Maintenance costs are frozen
Many solar payback calculations either do not include maintenance costs at all or assume that maintenance expenses will remain constant year after year.
This assumption is unrealistic.
In reality, operation and maintenance (O&M) costs increase gradually over time, just like with any long-term infrastructure installed outdoors.
Individually, these costs may appear small. But over a 20–25-year system life, they accumulate and quietly delay payback. Several real-world factors contribute to this increase.
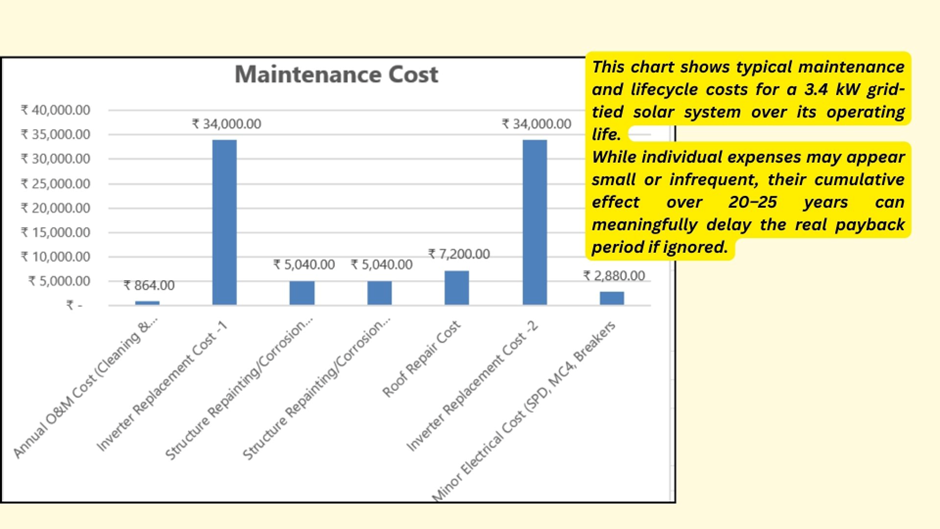
Over time, the mounting structure is exposed to weather and moisture, which can lead to corrosion. This often requires periodic repainting, corrosion removal, or minor structural repairs.
Because the system is installed on the rooftop, roof-related issues may also arise. Small cracks can develop near the mounting foundation points, requiring minor repairs to prevent water seepage or long-term damage.
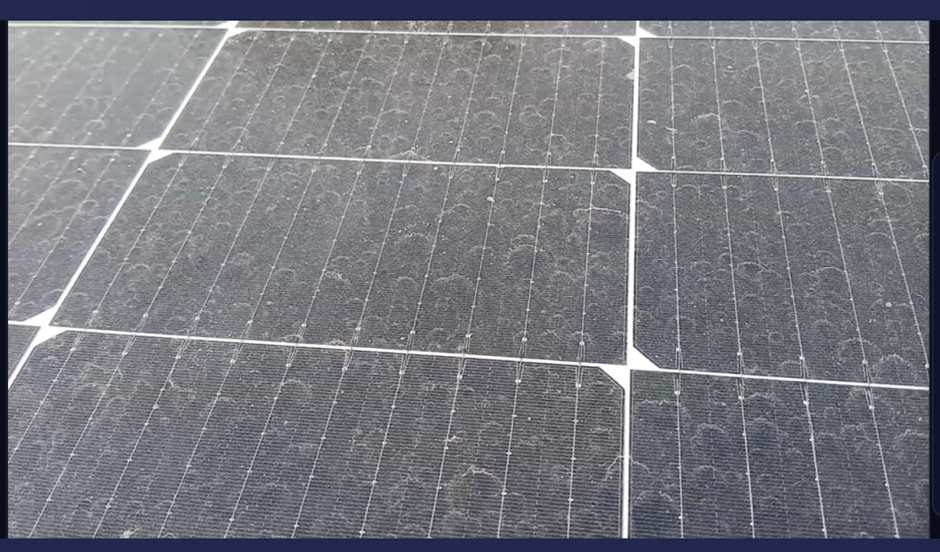
Dust accumulation is another overlooked factor. If panels are not cleaned regularly, generation reduces, savings fall, and payback is delayed.
Electrical components also age. With time:
- Wiring insulation can weaken
- Conduits may crack or break
- Exposed wires can allow moisture ingress, increasing the risk of faults or short circuits
These issues often require repair or partial replacement to keep the system safe and operational.
Even protection systems are not immune.
Components such as lightning arrestors and earthing connections can corrode over time and may need inspection, servicing, or replacement.
None of these costs is large on its own. But when they are ignored completely or assumed to be frozen, the payback calculation becomes overly optimistic.
Over the long term, these small, recurring expenses add up and push the real payback further out than expected.
Key insight: Small ignored costs accumulate into big delays.
Many of these overlooked expenses are discussed in detail in my article on Hidden Solar Costs That Increase Your Payback Period (And How to Reduce Them).
Assumption #6 (Loan users): EMI ≠ feasibility
For homeowners who plan to install solar using a loan, payback calculations often mix up affordability with feasibility.
If the monthly EMI appears manageable, the project is automatically assumed to be financially sound.
This is a mistake.
An affordable EMI does not automatically mean a good investment.
Most solar payback calculations for loan-based systems focus only on whether the monthly electricity bill savings are close to, or higher than, the EMI. What is often ignored is the total interest paid over the loan period.
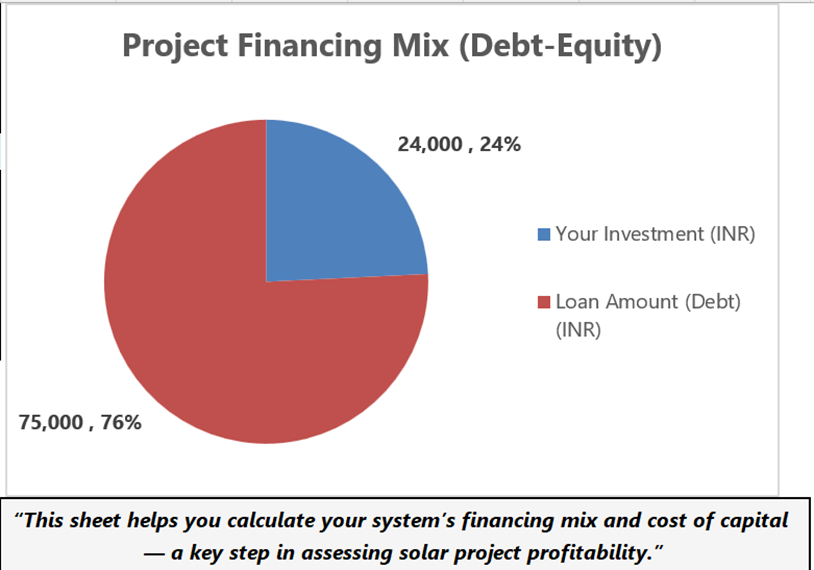
Interest is a real cost. It increases the effective system cost significantly — especially for longer tenures.
When interest cost is not included in the payback calculation:
- The initial investment appears smaller than it really is
- The payback period appears shorter
- The long-term return appears better than it actually is
In reality, a solar project that looks comfortable on a monthly EMI basis can still deliver weak financial returns once the full loan cost is considered.
This confusion is common because EMI-based comparisons are easy to explain and reassuring to hear. But they do not answer the most important question:
Is this solar system a good investment over its full life?
When loan interest is ignored, the payback calculation fails to provide an accurate answer to that question.
Key insight: An affordable EMI can still result in poor financial returns.
A real-world factor most payback calculations ignore
Most solar payback calculations assume that the electricity grid will be continuously available throughout the life of the solar system.
In reality, this is not always the case.
During hot summers, cold winters, or periods of high demand, grid shutdowns can occur due to overloads, faults, or maintenance issues.
In some locations, these outages are occasional. In others, they are frequent.
Islanding Effect
This matters because grid-connected solar systems automatically shut down when the grid goes offline.
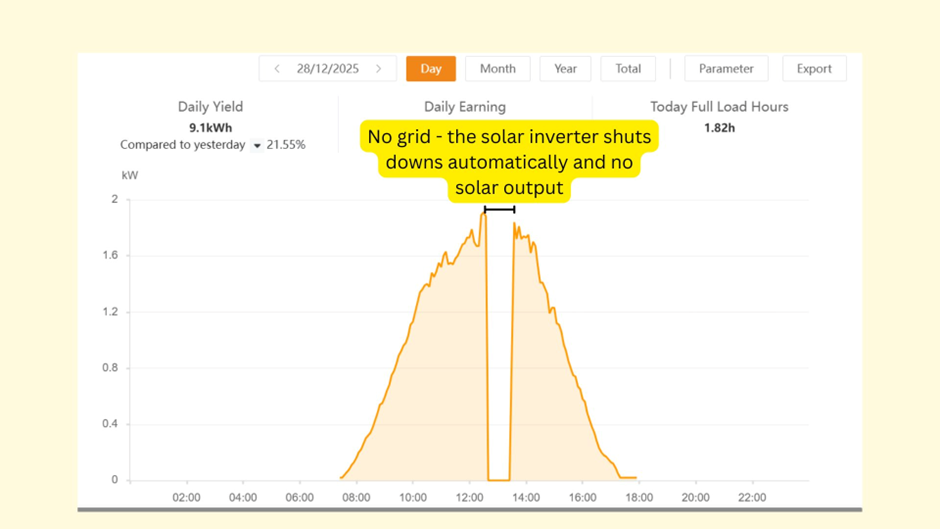
This safety mechanism is known as the islanding effect.
When the grid fails, the inverter is designed to stop solar power production to prevent electricity from feeding back into the grid and endangering line workers. As a result, no solar electricity is generated during grid outages, even if sunlight is available.
No generation means:
- No savings
- No bill offset
- No contribution toward payback
When grid outages are frequent or prolonged, this loss of generation quietly delays real payback.
This effect is often ignored because it does not appear in system sizing, cost calculations, or first-year generation estimates.
Two homes may have:
- The same system size
- The same installation cost
- The same panel technology
- The same electricity tariff
Yet the home experiencing more frequent grid shutdowns will see lower actual savings and a longer payback period.
This difference does not appear on paper — but it is clearly evident in real-world results.
Key insight: Solar savings depend not only on the system, but also on how reliably the grid stays online.
This is not a design flaw in rooftop solar, nor is it a calculation error by installers.
It is a real-world operational reality that paper-based payback calculations rarely account for.
In locations where grid outages are frequent, actual solar generation — and therefore savings — can be lower than what long-term averages suggest. As a result, two identical solar systems can experience different real payback periods, even when all other assumptions remain the same.
This does not mean solar is a bad investment. It means that real payback depends not only on system design and financial assumptions, but also on local operating conditions that models cannot fully control.
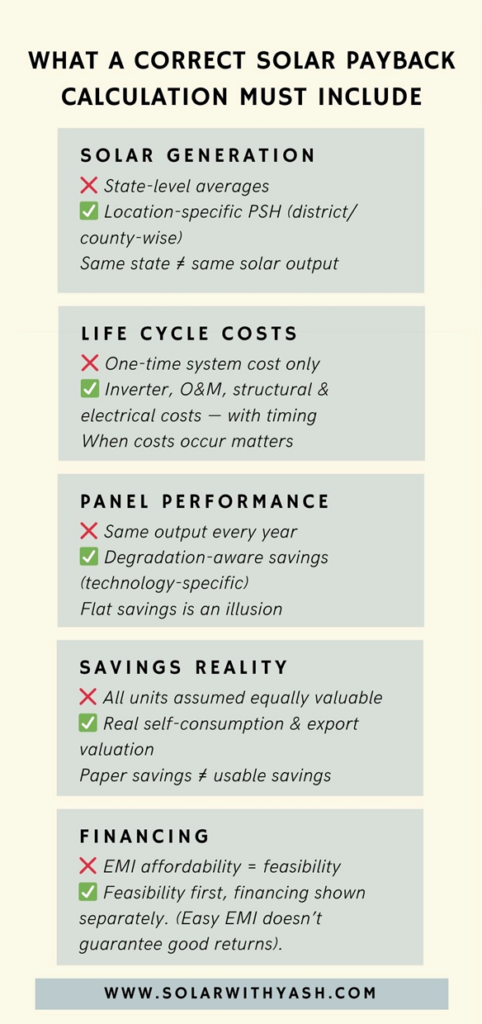
What a correct solar payback calculation must include
After understanding where most payback calculations go wrong, the next question is obvious:
What does a correct solar payback calculation actually require?
A realistic payback analysis is not about adding complexity. It is about including the right factors in the right way.
At a minimum, a correct framework must account for the following.
Location-specific generation, not broad averages
Solar generation depends heavily on local conditions.
Even within the same state, coastal regions often receive lower effective solar radiation than inland regions, leading to different generation outcomes.
Using a single state-average value hides these differences.
For accuracy, generation estimates should be based on district-wise or county-wise PSH data, not broad regional averages. This ensures that expected production reflects the actual location of the installation, not an averaged assumption.
Full lifecycle costs — with timing
Solar is a long-life system, but it is not cost-free after installation.
A correct payback calculation must include all lifecycle costs, such as:
- Inverter replacement
- Maintenance escalation
- Structural and electrical upkeep
Just as important as the cost itself is when it occurs.
Future expenses must be placed at the appropriate time in the project life, rather than being ignored or averaged out. Ignoring the timing of costs makes payback look artificially shorter.
Degradation-aware savings
Solar panels do not produce the same output every year.
A correct calculation must:
- Account for first-year degradation, which is typically higher
- Apply technology-specific degradation rates in subsequent years
Savings should then be calculated based on declining annual generation, not flat assumptions.
This ensures that long-term savings reflect how the system actually performs over time.
Realistic self-consumption, not idealized usage
Financial savings depend not just on how much electricity is generated, but on how much of that energy is actually used or valued.
A realistic framework must consider:
- Household usage patterns
- Export limitations, where applicable
- Differences between generated energy and usable savings
This avoids confusing paper generation numbers with real financial benefit.
Clear separation between feasibility and financing
Perhaps the most misunderstood aspect of solar economics is financing.
Easy EMI options may improve affordability, but they do not automatically make a project financially attractive.
A correct approach keeps these two questions separate:
- Is the solar project financially feasible on its own?
- How does financing affect monthly cash flow?
Interest cost should not be hidden inside system cost or ignored entirely.
Instead, financing impact should be shown clearly alongside savings, without distorting the underlying project feasibility.
Solar feasibility is about returns and long-term value, not just EMI comfort.
When these elements are included together, payback stops being a marketing number and becomes a decision-support metric.
This approach does not guarantee faster payback — but it prevents unrealistic expectations and costly surprises later.
Many of these elements are often listed when discussing solar economics, but their real impact is usually underestimated. I have covered these more broadly in my article on Top factors that impact the Solar Payback Period, while this analysis focuses on why simplified calculations still go wrong in practice.
“Correct analysis turns solar payback from a marketing number into a decision-support metric.”
Why this gap exists — and how I approached it
This gap between simple payback math and real financial outcomes is the reason I built the Solar Feasibility Spreadsheet (SFS).
The objective was not to create another calculator, but to model rooftop solar the way engineers and financiers actually evaluate projects — using transparent Excel-based logic that reflects location-specific generation, lifecycle costs, degradation, and financing effects.
Because solar economics, tariffs, and policies differ by country, SFS is available in two dedicated editions:
- SFS – India Edition, designed around Indian tariffs, district-level solar data, and local financing realities
- SFS – US Edition, structured for U.S. utilities, net-metering rules, and financing assumptions
Both editions follow the same core principle: to help homeowners understand what solar looks like financially in the real world, not just on paper.
Closing: Confidence comes from correct analysis
Rooftop solar can still be a very good long-term decision.
It offers a clear path toward clean energy, lower electricity costs, and greater financial stability — especially over the later years of life, including retirement.
The problem is not solar technology.
The problem arises when solar is evaluated using simplified or incomplete math.
When payback is calculated using optimistic assumptions, expectations are set unrealistically high. This often leads to disappointment later — not because the system failed, but because the numbers were never realistic to begin with.
On the other hand, correct analysis changes the experience completely.
When generation, degradation, lifecycle costs, and financing effects are understood clearly:
- Savings become predictable
- Costs are anticipated in advance
- Payback becomes manageable, not surprising
Knowing the real costs upfront gives homeowners the confidence to plan, to handle future expenses effectively, and to manage the project over its full life without stress.
Solar works best when it is approached as a long-term financial decision, not a short-term sales calculation.
With the right method and the right expectations, solar can deliver both economic value and peace of mind — not just today, but for decades to come.
Frequently Asked Questions
1. Does this mean solar payback calculations are always wrong?
No. Payback calculations are not wrong by default — they are often incomplete. When key factors like degradation, lifecycle costs, and financing are ignored, payback appears shorter than it turns out to be in practice.
2. Can solar still be a good investment despite these issues?
Yes. Solar can be an excellent long-term investment when evaluated correctly. The goal is not to reject solar, but to understand its financial performance realistically before committing.
3. Why do different calculators show different payback periods for the same system? Because calculators use different assumptions. Variations in sunlight data, degradation rates, self-consumption assumptions, and cost treatment can significantly change the result.
4. Is simple payback enough to decide on a solar installation?
Simple payback can provide a rough idea, but it should not be the only decision metric. Long-term projects like solar require lifecycle-aware analysis to avoid surprises later.
5. How can homeowners evaluate solar payback more accurately?
By using a framework that considers location-specific generation, lifecycle costs, degradation, and financing effects, instead of relying only on first-year savings or simplified calculators.
🔗 Free tool: Download my Solar Snap tool to quickly estimate solar potential at your home